
Six weeks of optimisation, and the fix was two lines
Profiling found the hot function. The hot function was called a thousand times for one reason.
TL;DR
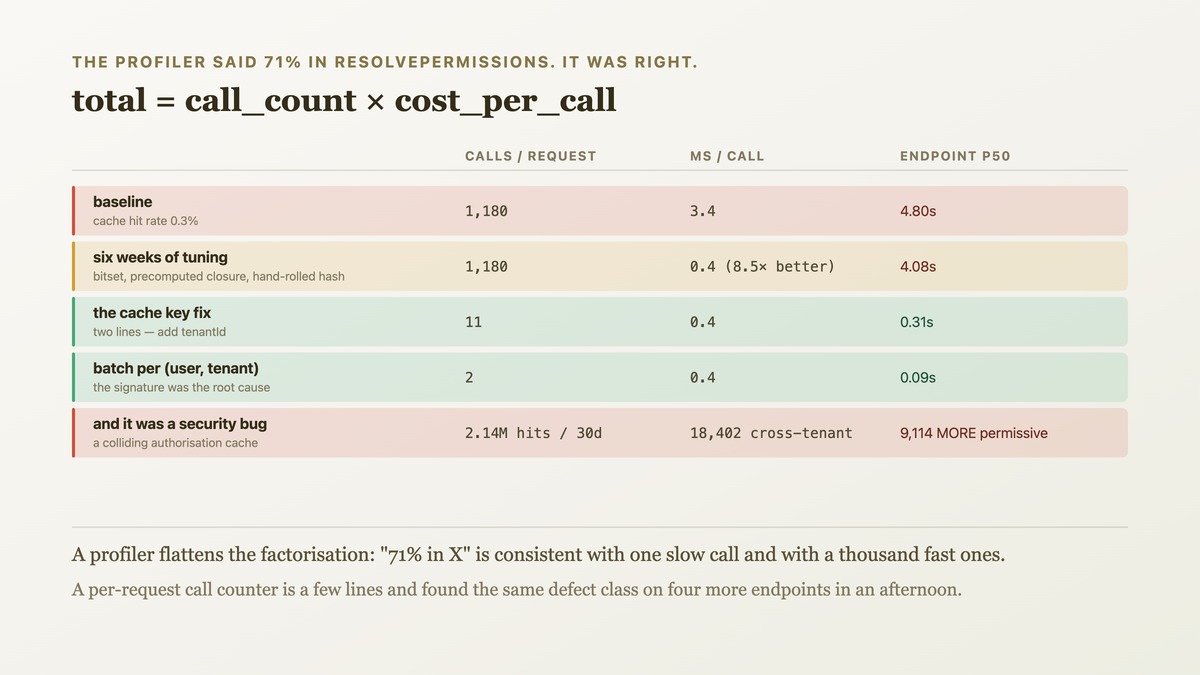
A report endpoint took 4.8 seconds. Profiling said 71% of the time was in resolvePermissions, so
we spent six weeks making resolvePermissions faster — a bitset representation, a precomputed
closure, a hand-rolled hash. We got it from 3.4ms to 0.4ms, an 8.5× improvement, and the endpoint
went from 4.8s to 4.1s.
The function was being called 1,180 times per request, because a cache key was missing a field, so every lookup missed. Fixing the key took two lines and the endpoint went to 0.3 seconds.
Profilers answer "where is the time". They do not answer "why does this run so often", and the second question is usually where the order-of-magnitude lives.
The case this post is about
A permissions-heavy report endpoint:
suspend fun report(userId: Long, range: DateRange): Report {
    val rows = db.reportRows(userId, range)                // ~1,200 rows
    return Report(rows.filter { row ->
        permissions.canView(userId, row.resourceId, row.tenantId)
    })
}
class PermissionService(private val repo: PermissionRepo, private val cache: Cache) {
    suspend fun canView(userId: Long, resourceId: String, tenantId: String): Boolean {
        val key = "perm:$userId:$resourceId"               // ← tenantId missing
        cache.get<Boolean>(key)?.let { return it }
        val allowed = resolvePermissions(userId, tenantId).contains(resourceId)   // 3.4ms
        cache.put(key, allowed, 5.minutes)
        return allowed
    }
}
And the profile, which pointed exactly where you would expect:
Async profiler, 60s under load
  71.2%  PermissionService.resolvePermissions
   8.1%  ReportQuery.reportRows
   4.4%  Json.encodeToString
The symptom
Six weeks of real, measurable improvement with almost no effect:
week   change                                 resolvePermissions   endpoint p50
0      baseline                                        3.4ms           4.80s
1      memoised the role-closure computation           2.1ms           4.62s
2      replaced the Set<String> with a bitset          1.2ms           4.41s
3      precomputed the tenant role graph at startup    0.7ms           4.24s
4      hand-rolled hash for the resource lookup        0.5ms           4.14s
6      removed an allocation in the hot loop           0.4ms           4.08s
An 8.5× improvement in the function, a 1.18× improvement in the endpoint. Every step was a genuine optimisation, verified by a microbenchmark, and the user-visible result was nothing.
The number nobody had looked at:
calls to resolvePermissions per request:   1,180
cache hit rate:                              0.3%
Eleven hundred and eighty calls for a 1,200-row report. The cache was effectively not working.
Why: the key omitted tenantId, so for a user with resources across several tenants the
same key held different answers — and something upstream was invalidating on mismatch. Worse, it
was also a correctness bug: a cached true for tenant A was being returned for tenant B.
cache key:  perm:88214:res_41
  tenant_acme   → true    (cached)
  tenant_globex → true    (WRONG — read from the same key)
So the performance symptom and a cross-tenant authorisation bug had one cause.
Why the obvious fix failed
"Optimise the hot function." Six weeks. It is what the profiler pointed at, and the profiler was correct about where the time went. The fix for "this function is 71% of the time" is not always "make this function faster".
"Parallelise the permission checks." Considered in week 3: 1,180 checks across 8 threads. It would have worked — 4.1s to about 0.6s — and it would have hidden the real problem behind more CPU, plus it leaves the cross-tenant bug entirely in place.
"Batch the checks into one query." Also considered, and genuinely a good design (it is in the final fix). On its own it would have reduced 1,180 round trips to 1 and still left the broken cache and the authorisation bug.
"Increase the cache TTL." The most tempting wrong fix: a longer TTL on a key that collides across tenants makes the authorisation bug last longer. We nearly shipped this in week 2.
The actual mechanism
Two different questions, and a profiler answers one of them:
"Where is the time going?" — a profiler's question. Answered by sampling stacks. Ours answered
correctly: resolvePermissions.
"Why does this code run this many times?" — nobody's question, unless you ask it. Answered by counting calls, not timing them.
The two factors also respond to effort very differently, which is the part that makes six weeks of
work feel justified throughout. cost_per_call improves incrementally — every optimisation buys a
few percent, so there is always visible progress and never an obvious moment to stop. call_count
is usually a step function: it is 1,180 because something is in a loop it does not need to be in,
and the fix takes it to 1, not to 900.
So the factor that yields steady encouraging progress is the one with a floor, and the factor with a 1000× improvement available gives no feedback at all until you look at it directly.
A profiler is built around the first question, and its presentation actively obscures the second.
Self-time, inclusive time and a flame graph's width are all products of the two factors — so a
function called 1,180 times at 3.4ms and a function called once at 4 seconds look identical in the
one view everybody opens. The six weeks went into optimising cost_per_call because that is the
factor the tool makes visible.
Total cost factorises:
total = call_count × cost_per_call
      =     1,180  ×       3.4ms    = 4.0s
Six weeks attacked the second factor and got 8.5×. One missing field in a cache key was inflating
the first factor by ~1,000×, and the two factors are not equally compressible: cost_per_call has a
floor (the work genuinely has to happen once), and call_count had no business being above 1.
The reason this is easy to miss is that a profiler flattens the factorisation. "71% in
resolvePermissions" is consistent with one slow call and with a thousand fast ones, and the two
have completely different fixes.

A profiler tells you where. It does not tell you why that code runs, and the order-of-magnitude wins are usually in the call count. Count before you optimise.
The fix
Two lines for the key, and then the batch query the problem had been pointing at all along.
// the two-line fix
val key = "perm:v2:$userId:$tenantId:$resourceId"      // tenantId included
cache hit rate:  0.3%  →  99.1%
endpoint p50:    4.08s  →  0.31s
Then the design that should have been there, because 1,200 cache hits is still 1,200 lookups:
// resolve once per (user, tenant), then check in memory
suspend fun report(userId: Long, range: DateRange): Report {
    val rows = db.reportRows(userId, range)

    // one resolution per distinct tenant in the result — typically 1–3
    val allowedByTenant: Map<String, Set<String>> =
        rows.map { it.tenantId }.distinct().associateWith { tenant ->
            permissions.allowedResources(userId, tenant)       // cached, per tenant
        }

    return Report(rows.filter { it.resourceId in allowedByTenant.getValue(it.tenantId) })
}
calls to resolvePermissions per request:  1,180 → 2
endpoint p50:                              0.31s → 0.09s
Three decisions:
The key is versioned (perm:v2:). Old entries have different semantics and must not be read.
Without the version bump, cached pre-fix values would have been served for five minutes — including
the wrong-tenant ones.
The batch resolves per (user, tenant) rather than per resource, which matches how permissions
are actually computed. The original signature invited a per-resource call, and the signature was the
root of the call-count problem.
And the six weeks of optimisation was kept. resolvePermissions at 0.4ms instead of 3.4ms still
helps — now that it runs twice instead of 1,180 times, it is 0.8ms instead of 6.8ms of the 90ms
total. Not wasted, and not the fix.
Plus the instrumentation that would have found it in an hour:
// per-request call counters, logged with the request
class CallCounter {
    private val counts = ConcurrentHashMap<String, AtomicInteger>()
    fun count(name: String) = counts.computeIfAbsent(name) { AtomicInteger() }.incrementAndGet()
    fun snapshot() = counts.mapValues { it.value.get() }
}
GET /report  200  312ms
  calls: {resolvePermissions=2, reportRows=1, cacheGet=3, cachePut=2}
A call-count line in the request log is the cheapest performance tool we have added.
How we proved it
The factorisation, measured directly:
                       calls/request   ms/call   total
baseline                      1,180       3.4     4.01s
after 6 weeks of tuning       1,180       0.4     0.47s  (+ 3.6s elsewhere → 4.08s)
after the cache key fix          11        0.4     0.004s → 0.31s endpoint
after the batch resolve            2       0.4     0.001s → 0.09s endpoint
That the cross-tenant bug was real, which reframed the whole thing from performance to correctness:
@Test
fun aCachedPermissionIsNotReusedAcrossTenants() = runTest {
    repo.allow(user = 88214, tenant = "acme",   resource = "res_41")
    repo.deny (user = 88214, tenant = "globex", resource = "res_41")

    assertTrue (permissions.canView(88214, "res_41", "acme"))
    assertFalse(permissions.canView(88214, "res_41", "globex"))   // ← was true
}
before:  FAILED — expected false but was true
after:   PASSED
And the exposure, from the logs, because that is the part that matters more than the latency:
cache hits on a colliding key, 30 days
  total:                   2,140,880
  cross-tenant mismatches:    18,402  (0.86%)
  of which more permissive:    9,114
Nine thousand over-permissive authorisation decisions. Disclosed; the audit log showed no evidence of the extra access being exercised, which mitigates and does not excuse it.
The call-counter, retrofitted to the other endpoints:
endpoints instrumented:                     28
with a call count >100 for one function:     6
of those, caused by a cache or key defect:   4
Four more instances of the same shape, found in an afternoon with a counter rather than six weeks with a profiler.
One honest limit: the six weeks were not pure waste — resolvePermissions is now genuinely fast and
is used by three other endpoints, two of which got measurably quicker. But the decision to spend
six weeks was made on a profile, and a call count would have redirected it on day one. The lesson is
about the order of questions, not about the value of the optimisation.
What this generalizes to
Total cost is call count times cost per call, and a profiler flattens them. "71% of time in function X" is consistent with one slow call and a thousand fast ones. Ask which before deciding what to fix; the two have different fixes and very different ceilings.
Count before you optimise. A per-request call counter is a few lines and it answers the question a profiler cannot. Four of our other endpoints had the same defect class, found by counting rather than by profiling.
A performance symptom can be a correctness bug. A cache miss rate of 99.7% meant the key was wrong, and a wrong key on an authorisation cache is a security problem. Investigating why the cache was ineffective found both; making the slow function faster would have found neither.
An interface that invites a per-item call will get a thousand of them. canView(user, resource)
made per-row checking natural. allowedResources(user, tenant) makes batch checking natural. The
call count was a consequence of the signature, which is where it should be fixed.
Related
- The cache that returned someone else's data — the same missing key dimension
- The N+1 query that looked fast in development — counting calls instead of timing them
- Engagement went up, and it was because the app got slower — asking why a number moved
Keep reading
This is part of 100 practices of senior engineers — the habits that separate five years of experience from one year five times. Follow MobileByteSensei for the rest.
One post a week, no digest
New writing when it lands. No roundups, no course pitch, no "10 tips".