
The N+1 query that looked fast in development
Ten rows locally, ten thousand in production. The query count scales with data.
TL;DR
An N+1 is one query to fetch a list plus one more per item. Locally, with 10 seed rows, that is 11 queries in 4ms and nothing looks wrong. In production with 10,000 rows it is 10,001 queries, and the endpoint takes 40 seconds.
The defect is invisible to every normal check: the code reads naturally, the local tests are fast, and a latency assertion passes because the local dataset is small. The thing that scales is the query count, and nothing was counting.
Assert the count, not the duration. A test that fails when a lazy relation starts loading per row catches this class before it ships, and it is about fifteen lines.
The case this post is about
An endpoint returning orders with their line items and each item's product:
@Get("/orders")
suspend fun orders(userId: Long): List<OrderView> {
    val orders = orderRepo.findByUser(userId)              // 1 query
    return orders.map { order ->
        OrderView(
            id = order.id,
            total = order.total,
            items = order.lineItems.map { item ->          // lazy: 1 query PER ORDER
                ItemView(
                    quantity = item.quantity,
                    productName = item.product.name,       // lazy: 1 query PER ITEM
                )
            },
        )
    }
}
Reads cleanly, maps domain objects to a view, no SQL in sight. That is the appeal of a lazy ORM
relation and also the problem: order.lineItems and item.product are database calls that look
like property access.
The symptom
A 40-second endpoint in production and a 4ms one locally:
local  (10 seed orders, 2 items each)
  GET /orders   4.1ms

production (user with 1,240 orders, ~3 items each)
  GET /orders   38.4s
The query log, which is where it became obvious:
production, one request
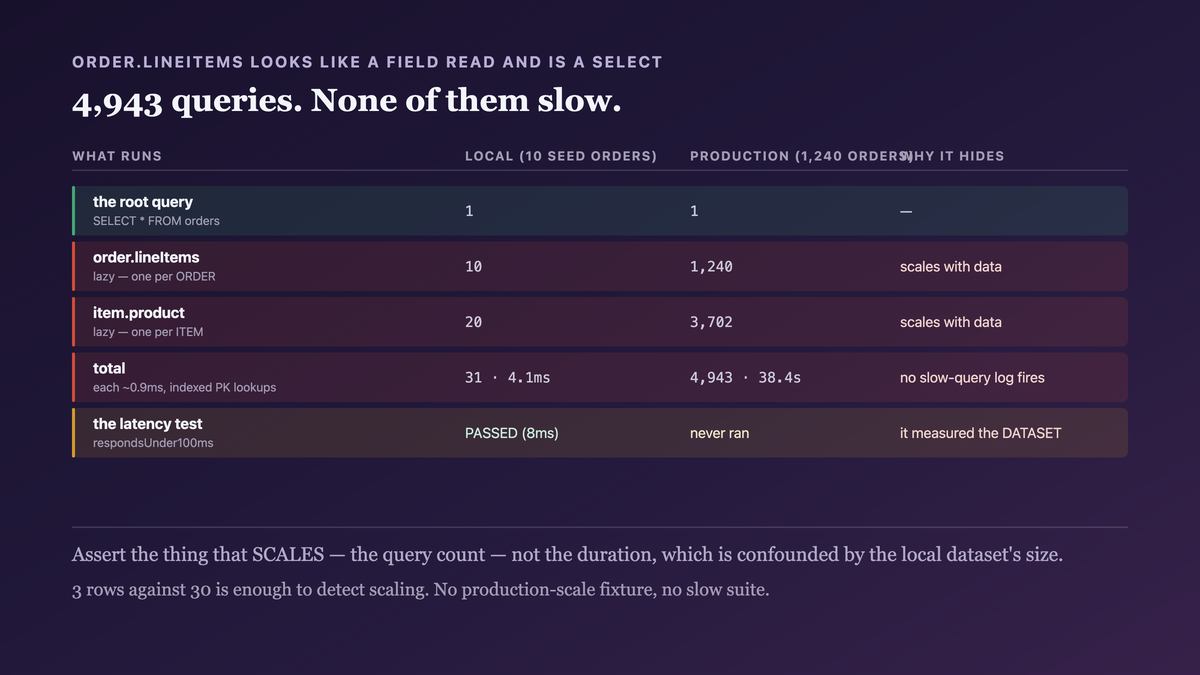
  SELECT * FROM orders WHERE user_id = ?                      1
  SELECT * FROM line_items WHERE order_id = ?             × 1,240
  SELECT * FROM products WHERE id = ?                     × 3,702
                                                     total 4,943
Nearly five thousand queries, each one fast — 0.9ms median — which is why no slow-query log fired and no database alert triggered. Five thousand times 0.9ms plus round-trip overhead is the 40 seconds.
And it degraded the whole service. The connection pool held 20 connections; one of these requests occupied one for 38 seconds, so twenty concurrent requests saturated the pool and unrelated endpoints began timing out.
The tests, all green:
OrdersEndpointTest > returnsOrdersWithItems   PASSED (12ms)
OrdersEndpointTest > respondsUnder100ms       PASSED (8ms)     ← a latency test that passed
The second one is the galling part: someone had written a performance test, and it passed, because it ran against 10 rows.
Why the obvious fix failed
"Add an index." Every one of those 4,943 queries was already an indexed primary-key or foreign-key lookup at 0.9ms. The problem is not query speed; it is query count. Indexing a fast query makes it no faster.
"Add a cache." Products cache well and line items do not — they are per-order. It cut 3,702 queries to about 900 on a warm cache and left 1,240. A 70% reduction in a number that should be 2.
"Increase the connection pool." Treats the saturation symptom and lets the 38-second request continue, now with more of them concurrently.
"Make the latency test stricter." It was respondsUnder100ms against 10 rows. Tightening the
bound does nothing; the dataset is the problem, and the dataset is what makes the test fast.
"Seed more data locally." Closer, and it is the fix people reach for — then local tests take 40 seconds each and someone reduces the seed data again within a month. Reproducing production volume in every test is too expensive to survive.
The actual mechanism
A lazy relation is a database call disguised as property access.
order.lineItems      // looks like a field read; is a SELECT
item.product         // same
Inside a map, that call happens once per element. So the query count is:
1                       the root query
+ N                     one per order        (lineItems)
+ Σ(items per order)    one per line item    (product)
= 1 + 1,240 + 3,702 = 4,943
Three properties make this specifically hard to catch:
The code gives no syntactic signal. Nothing distinguishes order.lineItems from order.total.
In a code review you have to know the entity mapping to see it.
Query count scales with data; local datasets are small. The relationship between seed size and query count is linear, so a 10-row dataset shows 1% of the problem and 100% of the correctness.
And every individual query is fast, so none of the usual database signals fire. Slow-query logs, query timeouts and per-query alerts are all tuned to find one slow query, not five thousand quick ones.

What scales here is the count, and the local environment is sized so the count stays small. A latency assertion against seed data measures the dataset, not the code.
Which points at the one assertion that does survive a small dataset: count the queries, not the milliseconds. Query count is a function of the code's shape, so it is the same on ten rows as on ten thousand — a 10-row fixture that issues 31 queries is proving the same defect that 1,240 orders turn into an outage.
@Test fun ordersPageIssuesAConstantNumberOfQueries() {
    seed(orders = 10)
    val a = countQueries { service.ordersPage() }

    seed(orders = 20)                 // double the data…
    val b = countQueries { service.ordersPage() }

    // …and the count must not move. This is the invariant; latency is not.
    assertEquals(a, b, "query count scales with data — N+1 somewhere in ordersPage()")
}
seed 10 → 31 queries
seed 20 → 61 queries
FAILED: query count scales with data — N+1 somewhere in ordersPage()
Two seed sizes rather than a threshold is the deliberate part. A fixed bound (assertTrue(n < 5))
needs updating every time a legitimate query is added and gets raised under deadline until it
asserts nothing. Comparing two sizes tests the property — constant with respect to data — which
is the actual claim, and it never needs tuning.
The fix
Fetch the graph in one query, and assert the count so it cannot regress.
// one query, with the relations joined
@Get("/orders")
suspend fun orders(userId: Long): List<OrderView> =
    orderRepo.findByUserWithItemsAndProducts(userId).map { it.toView() }
// repository — an explicit fetch plan
interface OrderRepository {
    @Query("""
        SELECT o FROM Order o
        LEFT JOIN FETCH o.lineItems i
        LEFT JOIN FETCH i.product
        WHERE o.userId = :userId
    """)
    suspend fun findByUserWithItemsAndProducts(userId: Long): List<Order>
}
Three decisions beyond the join:
Make lazy loading fail loudly outside a fetch plan. This is what turns the class of bug from "invisible" to "impossible to ship":
// test configuration — any lazy initialisation outside an explicit fetch throws
hibernate.enable_lazy_load_no_trans = false
Paginate, because one query returning 1,240 orders with 3,702 items is also wrong. The fix for query count is not an unbounded result set:
@Get("/orders")
suspend fun orders(userId: Long, page: Page): PagedResponse<OrderView> =
    orderRepo.findByUserWithItemsAndProducts(userId, page.limit(50)).toPaged()
And a projection rather than entities, since the view needs four fields and not the whole aggregate:
// the view's shape, straight from the database — no entity graph at all
@Query("""
    SELECT new OrderItemRow(o.id, o.total, i.quantity, p.name)
    FROM Order o JOIN o.lineItems i JOIN i.product p
    WHERE o.userId = :userId
    ORDER BY o.createdAt DESC
""")
suspend fun orderRows(userId: Long, limit: Int): List<OrderItemRow>
Then the test that makes it stick — counting queries, not timing them:
// a JDBC proxy that counts statements
class QueryCounter : StatementInspector {
    val count = AtomicInteger()
    override fun inspect(sql: String): String { count.incrementAndGet(); return sql }
}

@Test
fun ordersEndpointIssuesAConstantNumberOfQueries() = runTest {
    seedOrders(count = 3)
    counter.reset(); client.get("/orders?userId=1")
    val withThree = counter.count.get()

    seedOrders(count = 30)                     // 10× the data
    counter.reset(); client.get("/orders?userId=1")
    val withThirty = counter.count.get()

    assertEquals(withThree, withThirty,
        "query count scales with row count: $withThree → $withThirty")
}
Comparing two dataset sizes is the trick. It needs no production-scale seed data — 3 rows against 30 is enough to detect scaling, which is the actual property.
How we proved it
Query count and latency, before and after:
user with 1,240 orders
                  queries   latency
before              4,943    38.4s
cache (products)    2,140    16.1s
join fetch              1     0.21s
+ pagination (50)       1     0.04s
That the test detects the regression, verified by reverting the fix:
with the lazy mapping restored
  ordersEndpointIssuesAConstantNumberOfQueries  FAILED
    query count scales with row count: 10 → 91

with the join fetch
  PASSED  (1 → 1)
Ten to ninety-one on a 3-to-30 row change. That is the signal, available with trivial seed data.
And the pool-saturation effect, since that was the production impact:
20 concurrent /orders requests
  before:  pool exhausted after 20, unrelated endpoints timing out, p99 41s
  after:   pool max 3 in use, p99 0.08s
The audit for the same shape elsewhere, because this is never one endpoint:
endpoints instrumented with the query counter:       31
endpoints where count scaled with row count:          7
of those, in production code paths with >100 rows:    4
Four more live N+1s found by running the counting test against every endpoint, which took an afternoon.
One limit worth naming: LEFT JOIN FETCH across two collection relations can produce a cartesian
product — our line items per order are small (median 3) so the row multiplication is acceptable, and
for an aggregate with two large collections the correct fix is two queries, not one join. The
constant-query-count test still holds: two is constant, and that is what the assertion checks.
What this generalizes to
Assert on the thing that scales. Query count, allocation count, network round-trips, file handles, API calls. Latency is a consequence of these and is confounded by environment size. Measuring the cause gives you a test that works on tiny data.
Compare two dataset sizes. The property you want is "does this scale", and that is detectable with 3 rows against 30 — no production-scale fixture, no slow test suite. This is the cheapest performance test shape there is.
Beware anything that hides I/O behind syntax. Lazy relations, implicit remote property access, transparent proxies, overloaded operators that call out. Convenience that makes a network call look like a field read removes the reader's main cue that a cost exists.
Many fast operations do not trigger slow-operation alerts. Monitoring tuned to find one slow query is blind to five thousand quick ones. Whenever you alert on per-operation duration, also alert on per-request count.
Related
- The cache that returned someone else's data — the cache that was the first attempted fix
- Every timeout you set independently adds up to one that is wrong — the pool-saturation side of this
- The test that broke on every refactor was testing the wrong thing — assertions that measure the wrong property
Keep reading
This is part of 100 practices of senior engineers — the habits that separate five years of experience from one year five times. Follow MobileByteSensei for the rest.
One post a week, no digest
New writing when it lands. No roundups, no course pitch, no "10 tips".