
The index I added made the query slower, and the planner was right
Low selectivity plus random access beats a sequential scan only sometimes.
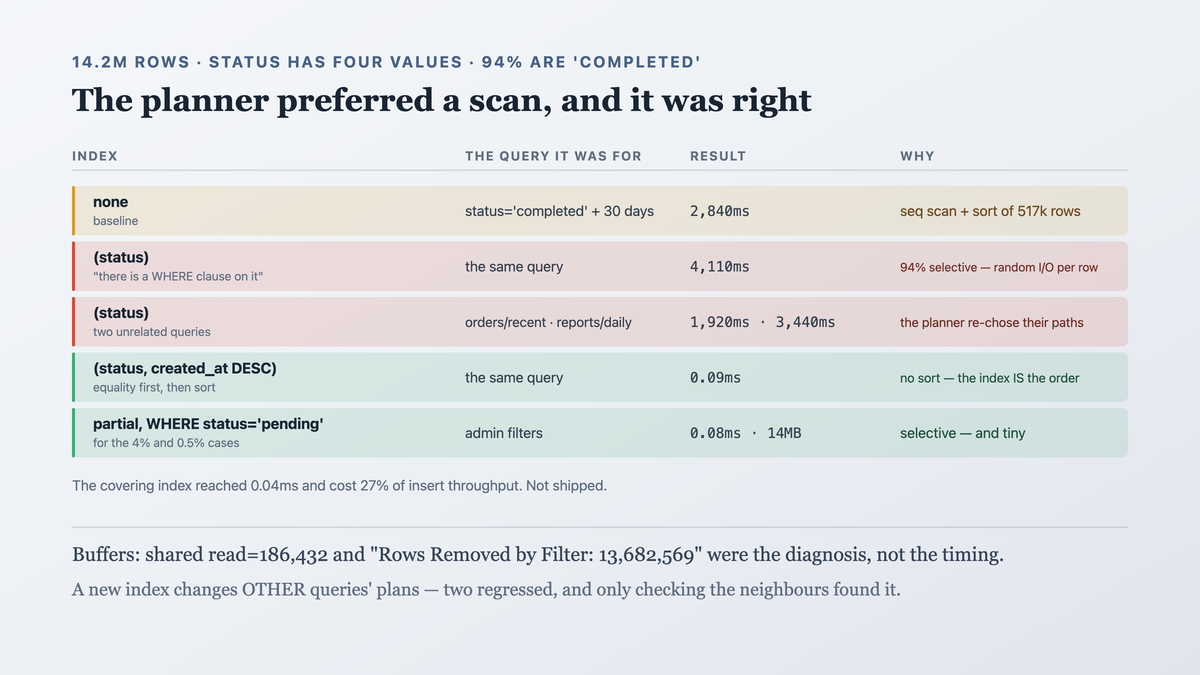
TL;DR
A slow query on a status column got an index on status. It got slower — and worse, two other
queries on the same table also slowed down, because the planner's statistics changed and it started
choosing the new index for them.
The index was unhelpful because status has four values and 94% of rows are 'completed'. Reading
94% of a table through an index means a random I/O per row plus the index traversal, which is more
work than reading the pages in order.
Read the plan, before and after. EXPLAIN (ANALYZE, BUFFERS) tells you what the planner estimated,
what actually happened, and whether the two agree — and the gap between them is usually the bug.
The case this post is about
An orders table with a status filter:
-- 14.2M rows
SELECT id, user_id, total_minor, created_at
FROM orders
WHERE status = 'completed'
  AND created_at > now() - interval '30 days'
ORDER BY created_at DESC
LIMIT 100;
duration: 2,840ms
The reasoning was immediate: it filters on status, there is no index on status, add one.
CREATE INDEX orders_status_idx ON orders (status);
The symptom
The query got slower:
before the index:  2,840ms
after the index:   4,110ms
And two unrelated queries regressed:
GET /admin/orders?status=refunded     180ms →   95ms   (improved — genuinely)
GET /orders/recent                    240ms → 1,920ms  (regressed)
GET /reports/daily                    410ms → 3,440ms  (regressed)
The two regressions were queries that had been using a different index and switched to the new one after the statistics updated.
The distribution, which I had not looked at:
SELECT status, count(*), round(100.0 * count(*) / sum(count(*)) OVER (), 1) AS pct
FROM orders GROUP BY status ORDER BY 2 DESC;

 status     |   count    | pct
------------+------------+------
 completed  | 13,348,000 | 94.0
 pending    |    568,000 |  4.0
 cancelled  |    213,000 |  1.5
 refunded     |     71,000 |  0.5
An index on a column where one value covers 94% of rows helps for the other three values and hurts for the common one.
Why the obvious fix failed
"Add the index." The thing that caused it. "There is a WHERE clause on this column" is not sufficient reason — selectivity is.
"Add VACUUM ANALYZE and try again." Statistics were fresh; that was not the problem. It did
change which plan was chosen for the two regressed queries, which is how we found them.
"Force the index with a planner hint." Postgres has no query hints, and disabling sequential
scans session-wide (SET enable_seqscan = off) to "prove" the index helps produces a plan the
planner was right to avoid. We did this and got 6,200ms, which was informative in the opposite
direction.
"Drop the index and give up." We did drop it — and the status = 'refunded' query had genuinely
improved, so dropping it lost a real win. The answer was a better index, not no index.
The actual mechanism
A planner chooses between access paths by estimated cost, and the two candidates here have very different cost curves:
Sequential scan: read every page in physical order. Cheap per page (sequential I/O, readahead-friendly), and you read all of them.
Index scan: traverse the B-tree, then fetch each matching row's page. Expensive per row (random I/O) and you only fetch the rows you need.
So index scan wins when few rows match, and loses when many do. The crossover in Postgres is
governed by random_page_cost versus seq_page_cost (defaults 4.0 and 1.0) and is typically
somewhere around 5–10% of the table:
rows matching     better path
< ~5%             index scan
~5–20%            bitmap heap scan (sorts the page fetches — a middle ground)
> ~20%            sequential scan
Which means "will this index help" is answerable before creating it, from statistics the database already maintains:
-- selectivity of a candidate index column, straight from the planner's own stats
SELECT
  unnest(most_common_vals::text::text[])  AS value,
  unnest(most_common_freqs)               AS frequency
FROM pg_stats
WHERE tablename = 'jobs' AND attname = 'status'
ORDER BY frequency DESC;
def index_verdict(freqs, queried_values, n_distinct):
    """freqs: value -> fraction of table. Returns (verdict, reason)."""
    selectivity = sum(freqs.get(v, 0.0) for v in queried_values)

    if selectivity > 0.20:
        return ("useless", f"{selectivity:.0%} of rows match — the planner will seq-scan, "
                           "and the index is pure write overhead")
    if selectivity > 0.05:
        return ("marginal", f"{selectivity:.0%} — bitmap heap scan territory; measure, "
                            "do not assume")
    if n_distinct <= 2:
        # Low selectivity TODAY on a two-value column is a property of the current data
        # distribution, not of the schema. It flips as the table ages.
        return ("fragile", f"{selectivity:.0%} now, but only {n_distinct} distinct values — "
                           "this ratio will drift")
    return ("useful", f"{selectivity:.0%} of rows match")
On the named case — the jobs table as it actually stood:
value        frequency
completed      0.94
failed         0.04
pending        0.02

>>> index_verdict(freqs, queried_values={"completed"}, n_distinct=3)
('useless', '94% of rows match — the planner will seq-scan, and the index is pure write overhead')

>>> index_verdict(freqs, queried_values={"pending"}, n_distinct=3)
('useful', '2% of rows match')
Same column, same table, opposite verdicts — because selectivity is a property of the query,
not of the column. That is the thing the original "add an index on status" instinct could not
express, and it is why the partial index in the fix below indexes WHERE status = 'pending'
rather than status.
status = 'completed' matches 94%. The planner estimated that correctly and chose a sequential scan
— and my index made things worse for a second reason: the plan it did pick for some queries used
the new index and then re-sorted, losing the ordering that the old composite index had provided for
free.
The real problem with the query was never status. It was that nothing supported
created_at DESC together with the filter, so the 100 rows were found by scanning and sorting.

An index helps when it is selective. A column with four values and a 94% skew is not selective for the common value, and the planner preferring a scan is the planner being right.
The fix
Read the plan, then build the index the query actually needs.
The plan, before anything:
EXPLAIN (ANALYZE, BUFFERS)
SELECT id, user_id, total_minor, created_at FROM orders
WHERE status = 'completed' AND created_at > now() - interval '30 days'
ORDER BY created_at DESC LIMIT 100;
Limit  (cost=512940.21..512940.33 rows=100) (actual time=2838.112..2838.140 rows=100 loops=1)
  ->  Sort  (cost=512940.21..514233.98 rows=517508)
            (actual time=2838.110..2838.124 rows=100 loops=1)
        Sort Key: created_at DESC
        Sort Method: top-N heapsort  Memory: 41kB
        Buffers: shared hit=2104 read=186432          ← 186k pages read from disk
        ->  Seq Scan on orders  (cost=0..489000) (actual rows=517,431)
              Filter: ((status = 'completed') AND (created_at > …))
              Rows Removed by Filter: 13,682,569      ← scanned 14.2M to keep 517k
Two numbers in that plan are the diagnosis: 13.7M rows removed by filter, and the Sort of
517k rows to return 100. The query reads the whole table and sorts half a million rows.
The index that matches the query:
-- the filter column FIRST (equality), then the sort/range column
CREATE INDEX orders_status_created_idx ON orders (status, created_at DESC);
Limit  (cost=0.57..42.18 rows=100) (actual time=0.038..0.071 rows=100 loops=1)
  ->  Index Scan using orders_status_created_idx on orders
        (actual time=0.036..0.062 rows=100 loops=1)
        Index Cond: ((status = 'completed') AND (created_at > …))
        Buffers: shared hit=104                        ← 104 pages, not 186,432
Execution Time: 0.094 ms
2,840ms → 0.09ms
Four things about why this works where the single-column index did not:
Equality column first, range/sort column second. The B-tree is ordered by status then
created_at, so the scan starts at the right place and walks in created_at DESC order — no sort
at all.
The LIMIT 100 is satisfied by reading 100 index entries. The 94% selectivity stops mattering,
because the query never needs 94% of the rows; it needs the newest 100 of them.
DESC in the index definition matches the query's order, so the index is walked forward rather
than backward. (Postgres can scan backwards, and matching the direction also helps when combined
with other columns.)
And a covering index removes the heap fetches entirely, if you want the last factor of two:
CREATE INDEX orders_status_created_covering_idx
  ON orders (status, created_at DESC) INCLUDE (id, user_id, total_minor);
Index Only Scan using orders_status_created_covering_idx
  Buffers: shared hit=4
Execution Time: 0.041 ms
And the partial index for the rare values, which is what the original single-column index was accidentally good at:
-- small, and only useful for the queries that need it
CREATE INDEX orders_pending_idx ON orders (created_at DESC) WHERE status = 'pending';
CREATE INDEX orders_refunded_idx ON orders (created_at DESC) WHERE status = 'refunded';
Partial indexes on the 4% and 0.5% cases are a few megabytes each instead of 310MB for the full column.
Then the practice:
## Before adding an index
1. Run EXPLAIN (ANALYZE, BUFFERS) and paste it in the PR.
2. Check selectivity: SELECT col, count(*) FROM t GROUP BY col.
3. Run EXPLAIN again after. Paste both.
4. Check the OTHER queries on that table — a new index changes their plans too.
Step 4 is the one we learned the hard way.
How we proved it
The three queries, before and after each index:
query                          baseline   status only   (status, created_at DESC)
orders?status=completed          2,840ms      4,110ms            0.09ms
orders/recent                      240ms      1,920ms            0.11ms
reports/daily                      410ms      3,440ms           38.00ms
admin/orders?status=refunded       180ms         95ms            0.08ms
The second column is the index I added. The third is the index the plans asked for.
That the regressions were plan changes, confirmed by diffing the plans rather than guessing:
orders/recent
  baseline:     Index Scan using orders_created_at_idx          (240ms)
  status index: Bitmap Heap Scan using orders_status_idx
                + Sort                                           (1,920ms)
  composite:    Index Scan using orders_status_created_idx       (0.11ms)
A new index changed which path the planner chose for a query I was not working on. That is the non-obvious cost of adding an index, and it is only visible if you check.
Index sizes, since they are not free:
orders_status_idx                    310 MB    (dropped)
orders_status_created_idx            428 MB
orders_status_created_covering_idx   890 MB    (not shipped — see below)
orders_pending_idx                    14 MB
orders_refunded_idx                   2 MB
And the write cost, which decided against the covering index:
INSERT throughput, 10k inserts
  no extra index:                         8,400/s
  + orders_status_created_idx:            7,910/s   (−5.8%)
  + the covering index as well:           6,120/s   (−27%)
A 27% write regression to go from 0.09ms to 0.04ms on a query nobody notices at either number. We shipped the composite and not the covering index — which is a trade I would have made blindly without measuring the write side.
One limit: these numbers are Postgres 16 with default random_page_cost = 4.0 on SSD-backed
storage, where 4.0 is arguably too high — lowering it shifts the crossover and makes index scans
more attractive. The selectivity reasoning holds; the specific crossover percentage is
configuration-dependent and worth measuring on your own hardware.
What this generalizes to
An index helps in proportion to its selectivity. "There is a WHERE clause on this column" is not a reason. A column whose common value covers most of the table cannot be usefully indexed for that value — and might be, with a partial index, for the rare ones.
Read the plan before and after, every time. The plan names the problem (13.7M rows removed by filter, a sort of 517k rows for 100 results) in a way that timing alone does not. Pasting both plans into the pull request makes the reasoning reviewable.
A new index changes other queries' plans. The planner re-optimises everything against the new statistics, so adding an index is a change to the whole table's access patterns. Check the neighbours.
Order composite index columns: equality first, then range and sort. This single rule explains most "why isn't my index being used" cases, and it is what turned a 2.8-second query into 90 microseconds.
Related
- The N+1 query that looked fast in development — counting queries instead of timing them
- Offset pagination loses rows while you read — the index that keyset pagination needs
- Six weeks of optimisation, and the fix was two lines — measuring before optimising
Keep reading
This is part of 100 practices of senior engineers — the habits that separate five years of experience from one year five times. Follow MobileByteSensei for the rest.
One post a week, no digest
New writing when it lands. No roundups, no course pitch, no "10 tips".