
Engagement went up, and it was because the app got slower
Time-in-app rose because loading took longer. A metric that improves under a regression is measuring the wrong thing.
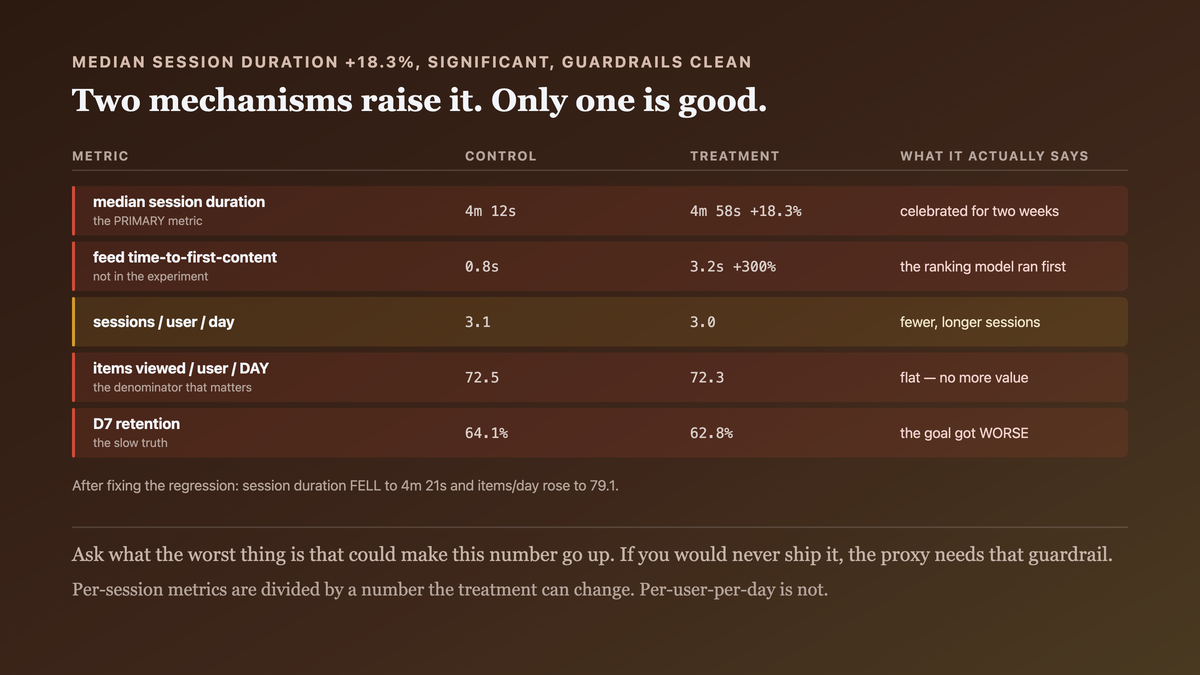
TL;DR
We shipped a release, and median session duration rose 18%. The team celebrated an engagement win for two weeks.
Session duration had gone up because a regression added 2.4 seconds to the feed load. Users were spending longer in the app because the app was wasting their time, and the metric was structurally unable to tell the difference.
A metric that can improve under a regression is a proxy pointing the wrong way. The test is to ask, before you adopt it: what is the worst thing that could make this number go up?
The case this post is about
A release with a new feed ranking model, measured against the team's headline metric:
primary metric:   median session duration
secondary:        sessions per user per day, feed items viewed
guardrails:       crash-free rate, API error rate
Results after a week at 50%:
                        control    treatment    change
median session           4m 12s      4m 58s     +18.3%  ✓ significant
sessions / user / day      3.1         3.0       −3.2%   ~
feed items viewed         23.4        24.1       +3.0%
crash-free rate          99.82%      99.79%      −0.03pp  (within guardrail)
API error rate            0.21%       0.24%      +0.03pp  (within guardrail)
Primary metric strongly positive, guardrails clean. Shipped to 100%.
The symptom
A support theme two weeks later, and then a user interview:
"the feed takes ages to load now"
"I open it and stare at the spinner"
Which did not match any guardrail. So we looked at a metric that was not in the experiment:
feed time-to-first-content (p50)
  control:    0.8s
  treatment:  3.2s        ← +2.4s
The new ranking model ran synchronously before the first item rendered.
And then the arithmetic that explained the "win":
sessions per user per day        3.1 → 3.0        (−0.1)
median session duration       4m 12s → 4m 58s     (+46s)
feed loads per session            6.2 → 6.1

added wait per session:  6.1 loads × 2.4s = 14.6s
Fourteen of the forty-six extra seconds were pure waiting. The remainder came from a second mechanism we had not considered: users scrolled further per session because fewer sessions happened, so each one carried more of the same total activity.
Total daily engagement, which nobody had been looking at:
                        control    treatment
sessions/user/day          3.1        3.0
duration/session        4m 12s     4m 58s
total time/user/day     13m 1s     14m 54s
feed items/user/day       72.5       72.3      ← flat
retention D7             64.1%      62.8%      ← down 1.3pp
Items viewed per day flat, retention down. The thing the metric was a proxy for had got worse.
Why the obvious fix failed
"Add latency to the guardrails." Necessary and we did it, and it is the fix for this instance rather than the class. The next proxy will fail in a direction the new guardrail does not cover.
"Use total daily time instead of session duration." Better, and still gameable in the same direction: a slower app that users check more often to compensate would raise it.
"Just use retention." The genuinely good metric here, and it moves slowly — D7 retention needs a week per read and large samples for significance. A team shipping weekly cannot steer by it alone, which is why proxies exist.
"Have a data scientist review every metric." Ours did review it. Session duration is a standard engagement metric and the review asked whether it was measured correctly, not whether it pointed the right way.
The actual mechanism
A proxy metric stands in for something you cannot measure directly. The substitution is valid only while the proxy and the real goal move together, and a regression can decouple them.
real goal:   users get value from the product
proxy:       they spend time in it

correlation holds when:  more value → more time
correlation breaks when: more friction → more time
Both increase the proxy. Only one increases the goal, and the metric cannot distinguish them because it measures duration, not cause.
Three properties made this survive two weeks:
The proxy moved in the expected direction. A positive result on the primary metric is where most analysis stops. Nobody asks why a win happened.
The guardrails were the wrong ones. Crash-free rate and error rate are correctness guardrails. The regression was a performance one, and nothing in the experiment measured it.
And the secondary metrics looked neutral, which read as "no harm". Items viewed per session was +3% — and per day it was flat, which is the comparison that mattered and was not in the report.
All three are checkable before a result is read, which is the only moment the check is honest. So the readout gained a gate in front of it:
def readout(exp, results, guardrails_measured):
    """Returns (verdict, notes). A 'win' requires surviving every check below."""
    notes = []

    # 1. A per-session metric moving while its per-DAY twin is flat means the sessions
    #    changed shape, not that more happened. This is the exact decoupling.
    for per_session, per_day in exp.rate_pairs:
        s, d = results[per_session], results[per_day]
        if s.lift > 0.01 and abs(d.lift) < 0.01:
            notes.append(f"{per_session} +{s.lift:.0%} but {per_day} flat "
                         f"({d.lift:+.1%}) — session shape changed, not volume")

    # 2. Guardrails must COVER the dimensions the change could plausibly move.
    #    Crash-free rate does not guard against a change that makes things slower.
    for dimension in exp.plausible_harms:
        if dimension not in guardrails_measured:
            notes.append(f"no guardrail for '{dimension}' — unmeasured, not unharmed")

    # 3. A duration proxy rising is ambiguous by construction and needs a tiebreaker.
    if results[exp.primary].lift > 0 and exp.primary_is_duration:
        if not exp.has_value_tiebreaker:
            notes.append(f"{exp.primary} is a duration proxy; +lift is consistent with "
                         "both more value and more friction")

    return ("INCONCLUSIVE" if notes else "WIN"), notes
On the named case, with the experiment exactly as it was configured:
verdict: INCONCLUSIVE
  - items_per_session +3% but items_per_day flat (+0.2%) — session shape changed, not volume
  - no guardrail for 'latency' — unmeasured, not unharmed
  - session_duration is a duration proxy; +lift is consistent with both more value and more friction
Every one of those three facts was present in the original report. None of them was a finding, because nothing was looking — the result was positive, so the analysis stopped. The gate's only real contribution is running before anybody sees the number go up.

The test for any proxy: what is the worst thing that could make this number go up? If the answer is something you would never ship deliberately, the proxy needs a guardrail aimed at exactly that.
The fix
Define metrics as a set with explicit failure directions, and make the per-unit normalisation part of the definition.
1. A metric definition that states how it can be gamed:
# metrics/session_duration.yaml
name: median_session_duration
kind: proxy
proxy_for: user_value
improves_when:
  - users find more worth doing          # intended
  - the app is slower                     # ← ADVERSARIAL. must be guarded.
  - sessions become rarer but longer      # ← ADVERSARIAL. must be normalised.
required_guardrails:
  - feed_time_to_first_content_p50        # caps the slowness route
  - items_viewed_per_user_per_day         # per-DAY, not per-session
  - retention_d7
Writing improves_when is the whole intervention. It took fifteen minutes and would have flagged
this experiment before it launched.
2. Normalise per user per day, not per session:
-- the denominator decides what the metric can hide
SELECT
  variant,
  SUM(session_seconds) / COUNT(DISTINCT user_id) / 7  AS seconds_per_user_per_day,
  SUM(feed_items_viewed) / COUNT(DISTINCT user_id) / 7 AS items_per_user_per_day
FROM sessions WHERE experiment = 'feed_ranking_v3'
GROUP BY variant;
Per-session metrics are divided by a number the treatment can change. Per-user-per-day is not.
3. Latency as a first-class guardrail with a real threshold:
guardrails:
  - metric: feed_time_to_first_content_p50
    max_regression: 10%        # would have failed at +300%
    action: block_rollout
4. And a "why did it win" requirement in the experiment review, which is the process change that generalises:
## Result review checklist
- [ ] Primary metric moved. **What mechanism caused it?**
- [ ] Is that mechanism one of the intended `improves_when` entries?
- [ ] Decompose the change: how much is attributable to each mechanism?
- [ ] Did any per-user-per-day metric move in the opposite direction?
A positive result now requires an explanation, not just a p-value.
How we proved it
The decomposition, which is what turned "engagement up" into "regression":
+46s median session duration, attributed
  added load wait (6.1 loads × 2.4s)        +14.6s    32%
  fewer sessions, same activity per day     +28.9s    63%
  genuine additional engagement              +2.5s     5%
Five percent of the "win" was the thing we thought we had shipped.
That the guardrail catches it, verified by replaying the experiment data against the new definition:
$ experiment-gate --replay feed_ranking_v3
  median_session_duration        +18.3%   ✓
  feed_time_to_first_content_p50 +300%    ✗ BLOCKED (max_regression 10%)
  items_per_user_per_day          −0.3%   ~
  retention_d7                   −1.3pp   ✗ BLOCKED
exit 1
Blocked on two of the four, retroactively. The latency guardrail is the one that would have fired within hours rather than needing a week of retention data.
And the outcome after fixing the actual regression — ranking moved off the critical path:
                           before fix   after fix
feed time-to-first-content      3.2s        0.7s
median session duration       4m 58s      4m 21s   ← the "win" mostly evaporated
items / user / day              72.3        79.1   ← the real improvement
retention D7                   62.8%       65.4%
Session duration went down and every metric that matters went up. That inversion is the clearest possible demonstration that the proxy was pointing the wrong way.
The audit of other metrics, since this was a definition problem rather than one bad experiment:
metrics in the primary dashboard:                  22
with an `improves_when` adversarial entry (before): 0
with one (after):                                  22
flagged as gameable in a direction with no guardrail: 7
Seven of twenty-two. Two of those seven were primary metrics on other teams' roadmaps.
One limit: the decomposition relies on an assumption about how session count and per-session activity interact, which we modelled rather than measured directly — the 63%/32% split is an estimate. The 5% figure for genuine engagement is therefore soft. The direction and the retention number are not estimates, and they are sufficient on their own.
What this generalizes to
Ask what would make the number go up for a bad reason. This single question, asked when a metric is adopted, catches most of this class. Write the answers down next to the definition so the guardrails are derivable from them.
A positive result deserves the same scrutiny as a negative one. Nobody investigates a win. The mechanism behind an improvement is as important as its significance, and "we don't know why it went up" should block a rollout.
The denominator is part of the metric. Per-session, per-user, per-day, per-request — the treatment can often change the denominator, which moves the ratio without changing anything real. Normalise by something the experiment cannot affect.
Fast proxies need guardrails; slow truths need patience. Retention was the right metric and too slow to steer by. The workable answer is a fast proxy plus guardrails aimed at its specific failure directions, with the slow metric as the periodic check that the proxy is still honest.
Related
- The dashboard nobody looked at, and the alert that fired every day — alerting on symptoms users feel
- We shipped it, measured it, and deleted it eleven weeks later — defining success before building
- The eval that passed because the function returned a plausible stub — a measure that rewarded the wrong property
Keep reading
This is part of 100 practices of senior engineers — the habits that separate five years of experience from one year five times. Follow MobileByteSensei for the rest.
One post a week, no digest
New writing when it lands. No roundups, no course pitch, no "10 tips".