
The dashboard nobody looked at, and the alert that fired every day
An alert that fires daily has trained everyone to ignore it, which is worse than no alert.
TL;DR
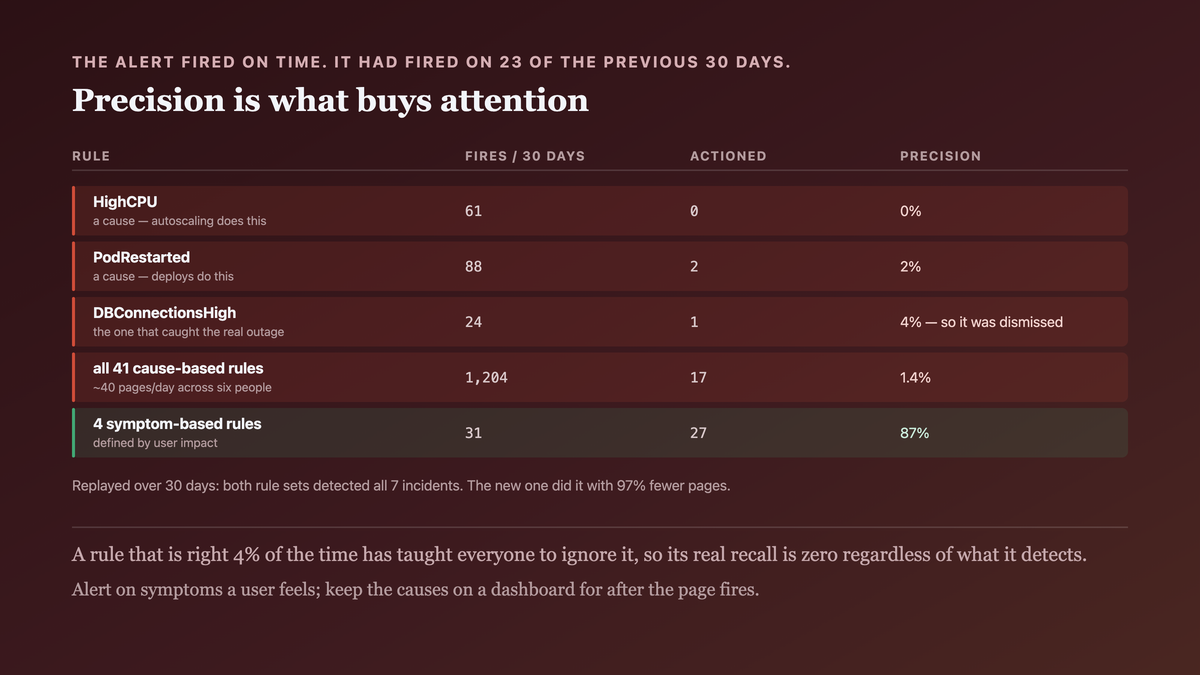
We had 41 alert rules and a 28-panel dashboard. During a real 50-minute outage, the alert that would have caught it fired on time — and was ignored, because that rule had fired on 23 of the previous 30 days.
An alert's value is not whether it detects the condition. It is whether a human acts on it, and that depends on its precision history. A rule with a 4% true-positive rate has trained its audience, correctly, to ignore it.
Alert on symptoms a user can feel, page only for things worth waking someone, and delete the rest. Fewer, better alerts beat more coverage.
The case this post is about
Alerting built the way it accumulates — one rule per incident post-mortem, each on the cause that was found:
- alert: HighCPU
  expr: avg(rate(cpu_seconds[5m])) by (pod) > 0.8
  for: 5m
- alert: PodRestarted
  expr: increase(kube_pod_container_status_restarts_total[15m]) > 0
- alert: DBConnectionsHigh
  expr: pg_stat_activity_count > 80
- alert: QueueDepth
  expr: queue_depth > 1000
# …37 more
Every one of them was added for a defensible reason by someone who had just been burned.
The symptom
The outage nobody was paged for. A sync endpoint degraded for 50 minutes:
09:12  p99 latency 240ms → 8.4s
09:12  DBConnectionsHigh FIRING          ← correct, and the 24th time that month
09:14  acknowledged, no action           "that one's always noisy"
09:31  user reports in support queue
10:02  engineer investigates the support reports, finds the real cause
10:04  mitigated
The alert worked. The alerting system did not, because its credibility was spent.
The noise, quantified. Thirty days of history:
alert                  fires   actioned   precision
DBConnectionsHigh         24          1        4%
HighCPU                   61          0        0%
PodRestarted              88          2        2%
QueueDepth                19          3       16%
…
total                  1,204         17       1.4%
Roughly forty pages a day across the team, and 1.4% of them meant anything.
The dashboard was unused. Twenty-eight panels, and the access log over 90 days:
dashboard views: 12 (9 by its author, 3 during the outage above)
During the outage, those three views did not help: nobody knew which of 28 panels mattered, because none of them was labelled with what good looked like.
Why the obvious fix failed
"Tune the thresholds." We raised DBConnectionsHigh from 80 to 150, which reduced fires to
about six a month and also meant it no longer fired during the next degradation, at 130
connections. Threshold tuning trades false positives for false negatives along the same bad axis.
"Route noisy alerts to a Slack channel instead of paging." This is real progress and it is also where alerts go to be never read. We did it, and six weeks later nobody could say what was in that channel.
"Add more panels so the dashboard answers more questions." It went from 28 panels to 36 and became less usable. A dashboard's value is inverse to how long it takes to find the one number that matters.
"Write a runbook for each alert." Forty-one runbooks, each one a paragraph saying "check if it's real". The problem was not that responders lacked instructions; it was that most fires had no action.
The actual mechanism
Three things, and the first is the one people skip.
An alert is a request for human attention, and attention is a fixed budget. Forty pages a day against a team of six is not forty times the coverage — it is a trained reflex to dismiss. The system's effective sensitivity goes down as rules are added.
Cause-based alerts have poor precision by construction. High CPU, a pod restart, deep queues — each is sometimes a problem and usually normal operation. A system that autoscales, rolls deploys and buffers work is supposed to do these things. Alerting on them means alerting on healthy behaviour.
Symptom-based alerts have good precision because they are defined by impact. "p99 latency on checkout above 2s for 5 minutes" is, by construction, something a user is experiencing. There is no healthy version of it.

An alert's worth is its precision, not its recall. A rule that is right 4% of the time has taught everyone to ignore it, so its real recall is zero regardless of what it detects.
The causes are still worth measuring. They belong on a dashboard you consult during an investigation — not in a pager.
Precision is computable from data the alerting system already keeps, which turns "which rules should we delete" from an argument into a report:
from collections import defaultdict

def triage(firings, min_sample=10, keep_above=0.5, delete_below=0.1):
    """firings: rows of (rule, acted_on: bool). Returns rule -> decision."""
    total, acted = defaultdict(int), defaultdict(int)
    for rule, was_acted_on in firings:
        total[rule] += 1
        if was_acted_on:
            acted[rule] += 1

    decisions = {}
    for rule, n in total.items():
        precision = acted[rule] / n

        if n < min_sample:
            # Too few firings to judge. NOT the same as "precise" — a rule that fired
            # twice and was actioned twice is 100% on a sample that proves nothing.
            decisions[rule] = ("insufficient-data", precision, n)
        elif precision >= keep_above:
            decisions[rule] = ("keep", precision, n)
        elif precision < delete_below:
            decisions[rule] = ("delete", precision, n)
        else:
            decisions[rule] = ("demote-to-dashboard", precision, n)

    # A rule that NEVER fired is invisible to the loop above — and is also the rule
    # most likely to be broken rather than quiet. Surface it rather than omitting it.
    return decisions

def never_fired(all_rules, firings):
    return sorted(set(all_rules) - {rule for rule, _ in firings})
On the named case — the thirty days of history, forty-one rules:
rule                          decision              precision   n
checkout_p99_latency          keep                      0.82    11
payment_provider_5xx          keep                      0.71     7   ← also insufficient-data
pod_restart_count             delete                    0.01   184
node_cpu_above_80             delete                    0.02   211
queue_depth_above_1000        demote-to-dashboard       0.14    96
jvm_old_gen_above_70          delete                    0.00    63

never fired in 30 days: disk_full_predicted, cert_expiry_14d, replica_lag_high
Two things that output decided. The delete block is four rules accounting for 521 of the 1,200
firings and five of the seventeen actions — the arithmetic nobody had done. And never fired is
the row that changed a mind: cert_expiry_14d had not fired because its query referenced a label
that was renamed in a migration, so it would also not have fired for a genuinely expiring
certificate. A silent rule reads as a quiet system and is indistinguishable from a broken one
until you ask.
The fix
Four paging alerts on symptoms. Everything else becomes a dashboard panel or is deleted.
# PAGE: a user is experiencing this right now.
- alert: CheckoutLatencyHigh
  expr: histogram_quantile(0.99,
          sum(rate(http_request_duration_seconds_bucket{route="/checkout"}[5m])) by (le)) > 2
  for: 5m
  labels: { severity: page }
  annotations:
    summary: "Checkout p99 {{ $value | humanizeDuration }} (SLO: 2s)"
    dashboard: "https://grafana/d/checkout-slo"
    runbook: "https://runbooks/checkout-latency"

- alert: CheckoutErrorRateHigh
  expr: sum(rate(http_requests_total{route="/checkout",status=~"5.."}[5m]))
        / sum(rate(http_requests_total{route="/checkout"}[5m])) > 0.01
  for: 5m
  labels: { severity: page }

- alert: SyncBacklogGrowing          # a symptom: data is getting stale for users
  expr: max(sync_oldest_pending_age_seconds) > 900
  for: 10m
  labels: { severity: page }

- alert: ErrorBudgetBurnFast         # multi-window burn rate on the SLO
  expr: (slo_error_budget_burn_rate_1h > 14) and (slo_error_budget_burn_rate_5m > 14)
  for: 2m
  labels: { severity: page }
Four decisions:
Each alert names a user-visible condition and cites the SLO it defends. The summary includes the value and the threshold, so the first ten seconds of triage happen in the notification.
for: is tuned to the symptom's duration, not minimised. A 5-minute window on latency removes
transient spikes that recover on their own, which were a large share of the old noise.
The burn-rate alert uses two windows. A fast-burn rule that requires both a 1-hour and a 5-minute signal fires on sustained problems and not on a single bad minute — this is the rule that replaced about a dozen cause-based ones.
And everything else is demoted, explicitly:
# TICKET, not page: worth fixing this week, nobody wakes up.
- alert: DiskWillFillIn4Days
  expr: predict_linear(node_filesystem_avail_bytes[6h], 4*24*3600) < 0
  labels: { severity: ticket }
High CPU, pod restarts and connection counts became dashboard panels. They are diagnostics for after a symptom alert fires.
The dashboard was rebuilt around one question per row:
row 1  "Is checkout healthy?"      p99 latency + error rate, with SLO threshold lines drawn
row 2  "If not, where?"            latency by downstream dependency
row 3  "What changed?"             deploy markers, feature flag changes, traffic
row 4  "Resource pressure"         CPU, connections, queue depth   ← the old 28 panels, demoted
Threshold lines drawn on the panels are the detail that mattered most: a graph without a "good" line requires the viewer to already know the answer.
How we proved it
That precision improved, measured over the following 30 days:
                       before            after
paging rules              41                 4
pages / 30 days        1,204                31
pages actioned            17                27
precision               1.4%               87%
And that recall did not drop, which is the claim that needed defending. Replaying 30 days of historical metrics against both rule sets:
incidents in the period (from the support/postmortem record):  7

detected by the old 41 rules:   7  (and 1,197 false positives)
detected by the new 4 rules:    7
median time-to-first-page:      old 4.2 min   new 5.1 min
Same seven incidents, 97% fewer pages, and about a minute slower to fire — which is the cost of
the for: windows and an acceptable trade for an alert anyone reads.
Then the behavioural outcome, which is the real result:
mean time to acknowledge
  before:  18 min   (and 'acknowledged' often meant dismissed)
  after:    2 min
And the dashboard:
views / 30 days
  before:  12  (9 by its author)
  after:   140 (used during 6 of 7 investigations, per incident notes)
Two honest limits. The replay compared rule definitions against stored metrics, which cannot fully reproduce how an on-call engineer would have behaved — the 7/7 recall is a property of the expressions, not a simulation of response. And deleting 37 rules means deliberately accepting that some causes now go unalerted; the bet is that a user-visible symptom will catch what matters, and the one case it would not is a slow degradation with no SLO impact, which we chose to accept as a ticket-level concern.
What this generalizes to
Precision is what buys attention, and attention is the scarce resource. This applies to alerts, to compiler warnings, to linter rules, to code review comments, to test failures. A signal that is usually wrong teaches people to ignore the channel, and then the one time it is right costs you an outage.
Alert on symptoms, measure causes. The distinction is whether a user is affected. Causes are invaluable for diagnosis and terrible for paging, because healthy systems produce them constantly.
Deleting a rule is a legitimate improvement. Thirty-seven deletions improved detection. Nobody is promoted for removing monitoring, which is exactly why it accumulates.
An unused dashboard is a design failure, not a discipline failure. Twelve views in ninety days is the dashboard telling you it does not answer a question anyone has. Organise by question, draw the threshold, and put the most important number first.
Related
- The retry that turned a blip into an outage — an incident the alerts did catch
- Your error message is an API, and changing it breaks someone — alerts as hidden dependencies
- Logs are for the questions you have not thought of yet — the other half of observability
Keep reading
This is part of 100 practices of senior engineers — the habits that separate five years of experience from one year five times. Follow MobileByteSensei for the rest.
One post a week, no digest
New writing when it lands. No roundups, no course pitch, no "10 tips".