
Logs are for the questions you have not thought of yet
A metric answers a question you already had. The difference is cardinality.
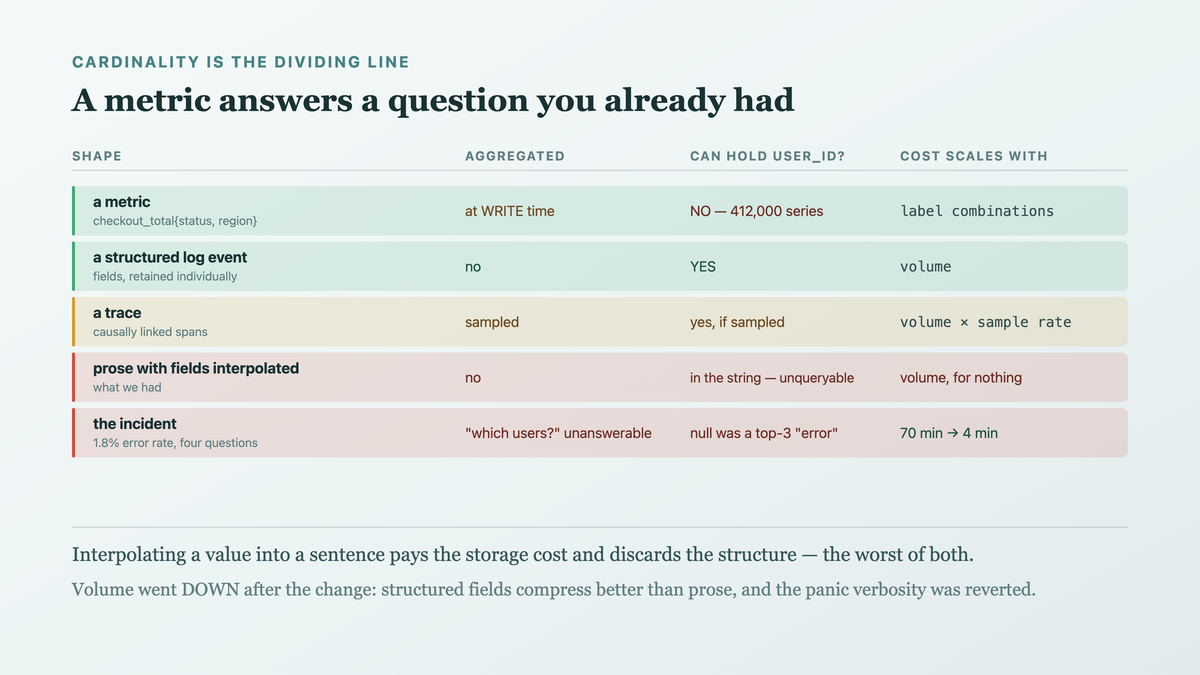
TL;DR
A metric is a pre-aggregated counter. You decide the dimensions up front, and at query time you can only slice by those. That is what makes metrics cheap and fast — and it means a metric can only answer questions you anticipated.
A log line is a structured event with whatever identifiers you attached. High-cardinality fields — user id, request id, tenant, device model — are exactly what a metric cannot hold and exactly what you need at 3am when the question is "what is different about the twelve users this is happening to".
So: metrics for is something wrong, logs and traces for what. The mistake is logging prose instead of fields, which gives you the cost of logs and the queryability of neither.
The case this post is about
A checkout service with what looked like good observability:
// metrics
checkoutCounter.labels(status).inc()
checkoutLatency.observe(durationMs)

// logs
log.info("Checkout completed for user ${user.id} in ${durationMs}ms")
log.error("Checkout failed: ${e.message}")
A dashboard, an alert, and a log line per request. It had been enough for a year.
The symptom
An alert fired correctly, and then the investigation stalled:
CheckoutErrorRateHigh 1.8% (SLO 1%)
Four questions, none answerable.
"Which users?" The error rate was a counter. Slicing by user was impossible — and adding a
user_id label to a Prometheus counter is the standard way to destroy a metrics backend, so the
instinct to "just add a label" was correctly resisted and left us stuck.
"Is it one tenant?" No tenant dimension existed on the metric, and the log line did not include one.
"What do the failures have in common?" The logs were prose, so this was a grep:
$ grep "Checkout failed" app.log | sort | uniq -c | sort -rn | head
   412 Checkout failed: Insufficient funds
   108 Checkout failed: null
    96 Checkout failed: Connection reset
null in 108 cases, and no way to know anything else about those requests.
"Can we see one failing request end to end?" No request id anywhere, so correlating the checkout log with the payment-gateway log and the database slow-query log was manual timestamp-matching across three systems.
It took 70 minutes to discover that the failures were one payment provider timing out for one card type in one region — a fact that a single query would have produced in seconds, had the data been queryable.
Why the obvious fix failed
"Add a user_id label to the metric." This is the trap, and avoiding it is correct: each
unique label value creates a new time series. 400,000 users means 400,000 series per metric, which
takes down the metrics backend. Cardinality is the hard limit on what a metric can hold.
"Log more." We increased verbosity and got 4× the volume of unqueryable prose. More of the wrong shape is not progress — and the storage bill went up 300%.
"Grep harder." grep with a regex over interpolated strings is what we were already doing. The
information was genuinely absent, not merely hard to extract.
"Add a trace." The right answer eventually, and distributed tracing with default sampling at 1% meant the twelve affected users were almost certainly not sampled. Tracing without tail-based or error-biased sampling does not help with a rare failure.
The actual mechanism
Three tools, three different shapes, and the shapes determine what questions are answerable.
A metric is pre-aggregated at write time. checkout_total{status="error"} is a number per
label combination per scrape interval. Querying is fast because the aggregation already happened —
and the dimensions are therefore fixed before the question exists. Cost scales with the number of
label combinations, not with traffic.
A log line is an event retained individually. Whatever fields you attached are queryable later, including unique ones. Cost scales with volume.
A trace is a causally-linked set of spans, which answers "where did the time go in this one request" — subject to sampling.
So the division is about cardinality:
Low cardinality → metrics. Status, route, region, method. A handful of values each.
High cardinality → logs and traces. User id, request id, tenant, card type, device model, error code. Unbounded or large.
And the failure in our setup was not choosing wrongly between them — it was that the logs
threw away their advantage by formatting fields into a sentence. "for user ${user.id} in ${durationMs}ms" has the cost of a log line and the queryability of a string.

The practical consequence is that the defect is syntactic — a $ inside a log message — which
means it is detectable rather than a matter of discipline. A logger that cannot express the wrong
shape, plus a scan for the calls that predate it:
/** The message is a CONSTANT. Everything variable is a field, by construction. */
fun log(event: String, vararg fields: Pair<String, Any?>) {
    require('$' !in event) {
        "log event '$event' interpolates a value. The message names WHAT happened; " +
            "values go in fields, or they are unqueryable."
    }
    val payload = fields.toMap() + ("event" to event) + ("ts" to Clock.System.now())
    sink.write(Json.encodeToString(payload))
}

log("checkout.failed", "user" to user.id, "duration_ms" to elapsed, "reason" to e.code)
# the 400 call sites written before the above existed
rg --no-heading -n 'log(ger)?\.(info|warn|error)\("[^"]*\$' src/ \
  | tee /dev/stderr | wc -l
On the named case — the codebase as it stood during the incident:
src/checkout/CheckoutService.kt:118: logger.info("checkout failed for user ${user.id} in ${ms}ms")
src/sync/SyncWorker.kt:64:          logger.warn("retry ${attempt} of ${max} for ${job.id}")
… 412 total
Four hundred and twelve lines that each cost storage and answer nothing. The require is what
stops the count growing while you work through them — and it fails at the call, in a test, rather
than during the incident six months later when somebody needs to group by reason and discovers
it was never a field.
A metric answers questions you wrote down in advance. A structured log answers the one you get during an incident. Interpolating your fields into a sentence gives up the second without gaining the first.
The fix
Structured events with high-cardinality fields, a request id threaded through, and metrics kept deliberately low-cardinality.
// one structured event per checkout — fields, not prose
log.atInfo()
    .addKeyValue("event", "checkout_completed")
    .addKeyValue("request_id", ctx.requestId)
    .addKeyValue("user_id", user.id)
    .addKeyValue("tenant_id", user.tenantId)
    .addKeyValue("duration_ms", durationMs)
    .addKeyValue("payment_provider", provider.name)
    .addKeyValue("card_type", card.type)
    .addKeyValue("region", ctx.region)
    .addKeyValue("amount_minor", order.totalMinor)
    .log("checkout completed")          // the message is for humans; the fields are the data
// failures carry the same fields PLUS a stable code
log.atError()
    .addKeyValue("event", "checkout_failed")
    .addKeyValue("request_id", ctx.requestId)
    .addKeyValue("user_id", user.id)
    .addKeyValue("error_code", e.code)          // ← stable enum, not e.message
    .addKeyValue("payment_provider", provider.name)
    .addKeyValue("card_type", card.type)
    .setCause(e)
    .log("checkout failed")
Four decisions:
The message string carries no data. Every variable is a field. This is the single change that makes the 70-minute investigation a one-query one.
error_code instead of e.message. A stable enum groups reliably; a message groups by
whatever copy it currently has — and null as a top-3 "error" was a symptom of that.
The same fields on success and failure. Comparing failing requests to succeeding ones is the most common incident question, and it requires both to be described identically.
A request_id generated at the edge and propagated through every service and into the
database's application_name, so three systems' logs can be joined.
Metrics stay low-cardinality, with the dimensions chosen for alerting:
// region and provider are bounded; user and request are NOT labels
checkoutCounter.labels(status, region, provider.name).inc()
And error-biased trace sampling, so rare failures are actually captured:
sample 100% of traces with an error span
sample 1% of successful traces
How we proved it
The query that replaces the investigation. Same incident, after the change:
sum by (payment_provider, card_type, region) (
  count_over_time({app="checkout"} | json | event="checkout_failed" [15m])
)

provider=stripe     card=visa        region=eu-west   3
provider=adyen      card=amex        region=us-east   189   ← there it is
provider=adyen      card=visa        region=us-east   4
One query, one grouping, seconds. The 189 is the whole incident, and nothing about the data model made it hard to find.
Time-to-cause, measured on the next three incidents:
                  before (median)   after (median)
time to cause       68 min            4 min
Three incidents is a small sample and the direction is unambiguous.
That cardinality did not blow up the metrics backend — the thing the naive fix would have broken:
active time series
  before:                        1,840
  after (region+provider added): 2,210
  if user_id had been a label:   ~412,000  (projected from distinct users)
Including the counterfactual is the point: it records why user_id is a log field and not a metric
label, so the next person does not helpfully "improve" it.
And the cost, because structured logging is not free:
log volume
  before (prose, verbose after our failed fix):  48 GB/day
  after (structured, INFO + sampled DEBUG):      31 GB/day
Lower, which surprised me. Two reasons: the panic-increased verbosity was reverted, and structured fields compress far better than interpolated sentences.
One limit: we kept 30 days of logs, so a question about something three months ago is still unanswerable — metrics cover the long window at low cardinality, and that boundary is a real one rather than something this fix removes.
What this generalizes to
Pre-aggregation trades future questions for present speed. Metrics, materialised views, summary tables, rolled-up analytics — all fast, all limited to the dimensions you chose. Keep one raw, queryable layer underneath for the questions that have not happened yet.
Cardinality is the dividing line. When deciding where a piece of data belongs, ask how many distinct values it has. Bounded and small → a dimension. Unbounded → a field on an event. Getting this backwards either breaks your metrics backend or makes your logs useless.
A log message is for humans; its fields are for machines. Interpolating values into prose pays the storage cost and discards the structure. The message should be a stable, greppable label — the data lives beside it.
Thread one identifier through everything. A request id turns N independent log streams into one joinable record. It is a few lines of middleware and the highest-leverage observability work available.
Related
- The dashboard nobody looked at, and the alert that fired every day — the metrics half of this
- Your error message is an API, and changing it breaks someone — why error_code and not e.message
- There is no Logcat in commonMain, and println is not a logger — the same lesson, client-side
Keep reading
This is part of 100 practices of senior engineers — the habits that separate five years of experience from one year five times. Follow MobileByteSensei for the rest.
One post a week, no digest
New writing when it lands. No roundups, no course pitch, no "10 tips".