
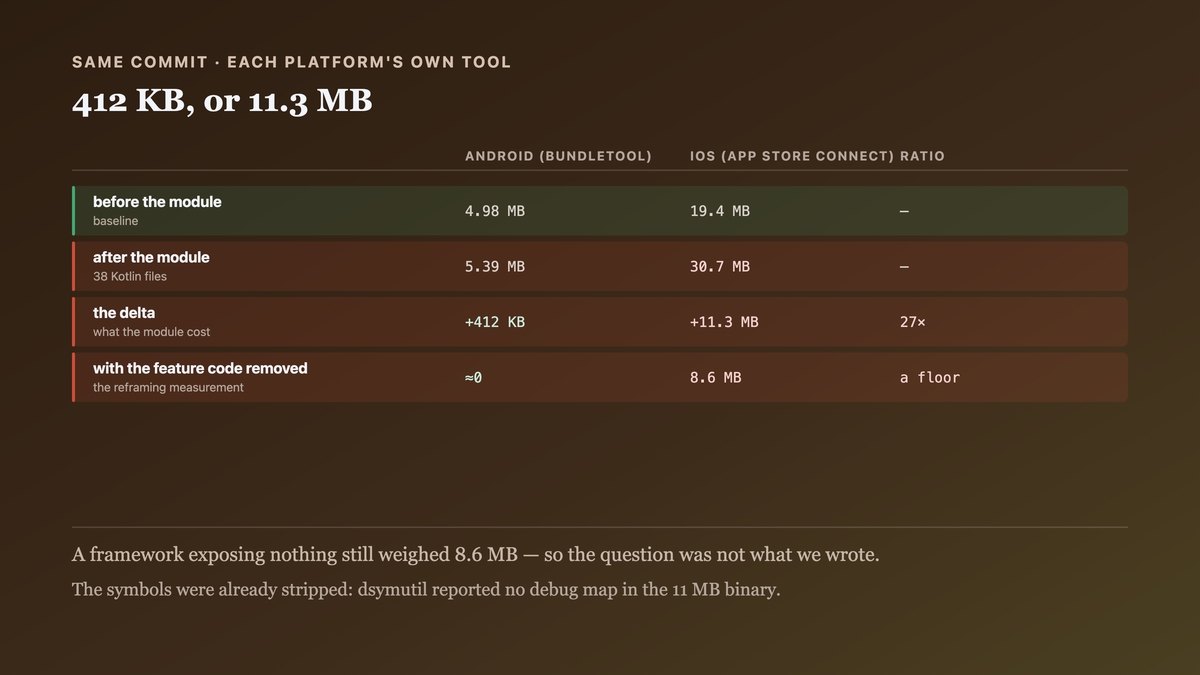
The shared module cost 400KB on Android and 11MB on iOS
Android shrinks against a runtime already on the device. iOS links yours in.
TL;DR
- One shared module, measured: +412 KB to the Android app download and +11.3 MB to the iOS one. Same Kotlin, same commit, same feature set.
- The asymmetry is not a build misconfiguration. Android links against a Kotlin runtime the device already has and shrinks what is left; iOS statically links the runtime into your binary and shrinks nothing by default.
- Three changes took the iOS framework from 11.2 MB to 4.1 MB without removing a feature — a fourth was measured and deliberately not made — and the largest of the three was not code.
- What reading on buys: the four measurements that locate the bytes, which of them the App Store actually charges for, and the one change that looked like it should help and did not.
The case this post is about
A shared module added to an existing pair of apps — 38 Kotlin files, Ktor, kotlinx.serialization,
SQLDelight, a Store5 cache. The release build, before and after, from each platform's own tooling:
# Android — the figure Play reports, not the APK on disk
$ ./gradlew :androidApp:bundleRelease
$ bundletool get-size total --apks=app.apks --dimensions=SDK,ABI
  MIN  4,982,112      # before
  MIN  5,394,256      # after      +412 KB
# iOS — the archive figure, which is the one that was actually to hand
$ xcodebuild -scheme iosApp -configuration Release archive …
$ du -sh iosApp.xcarchive/Products/Applications/iosApp.app
  19.4 MB      # before
  30.7 MB      # after      +11.3 MB
Twenty-seven times the cost, for the same code.
The symptom
Not a build failure — a review comment on the release PR, from someone who watches the size report:
iOS download size is up 11.3MB this release. What shipped?
And no good answer, because the Android number had been checked and looked fine. The first instinct was that the iOS build was including debug information, which it was not:
$ ls -lh iosApp.xcarchive/Products/Applications/iosApp.app/Frameworks/
 11M  shared.framework/shared
$ dsymutil --dump-debug-map shared.framework/shared 2>&1 | head -1
error: no debug map in shared
Eleven megabytes of stripped binary. The symbols were already gone, and the bytes were not debug information.
The second measurement was the one that reframed it — the size of the framework with the feature code removed but the module still linked:
# an empty public API, every file still compiled in
 8.6M  shared.framework/shared
Eight and a half megabytes for a framework exposing nothing. So the feature code was 2.7 MB and the floor was 8.6, which meant the question was not "what did we write" but "what arrives before we write anything".

Why the obvious fix failed
The obvious fix is to enable optimisation on the release framework, on the theory that the debug framework had been measured:
// shared/build.gradle.kts
iosArm64 { binaries.framework { baseName = "shared"; isStatic = true } }
The archive already used the release framework; isStatic changed the linkage and not the
size. 11.3 MB → 11.2 MB.
The second attempt was dead-code elimination, which on the JVM side is what R8 does and is worth most of the Android figure:
# -Xlambdas=class, -opt, and the linker's own dead-strip
$ otool -l shared.framework/shared | grep -c LC_FUNCTION_STARTS
1
Kotlin/Native's linker already dead-strips unreachable code, and the result was 11.2 MB → 10.9 MB. Real and not the answer.
The third guess was the dependencies, measured by removing them cumulatively — each row is the row above it with one more dependency gone. That produced the first useful number and the first surprise:
                                     framework size
all dependencies                        11.2 MB
− SQLDelight                             9.8 MB
− Ktor                                   8.9 MB
− kotlinx.serialization                  8.4 MB
− ALL dependencies, empty public API     7.9 MB
Removing every dependency and every line of our own code left 7.9 MB — with the framework's default export settings. That number is the whole post, and at this point in the investigation it looked immovable, because it is not our code. The fix section is where "floor" turns out to be the wrong word for it, and why is the most useful thing here.
The actual mechanism
The two platforms link against the Kotlin runtime differently, and the difference is structural rather than configurable.
On Android, the Kotlin runtime is a library the app already needs. kotlin-stdlib is a jar
that R8 processes along with everything else: unreachable classes are removed, the remainder is
merged into the app's dex, and the parts the platform itself provides are not duplicated. An app
that already uses Kotlin has already paid for the stdlib, so a new module adds only what it
actually references. 412 KB is our 38 files plus the reachable slice of three libraries.
On iOS, the Kotlin/Native runtime is statically linked into your framework. It is not a system library and there is nothing on the device to link against, so the framework carries a memory manager, a garbage collector, exception-handling machinery, the Obj-C interop bridge and the reflection metadata the exporter needs. That is most of the 7.9 MB, and every Kotlin framework in every app pays some version of it.
And the exported API surface is itself a cost. This is the part I had not expected to matter
and it turned out to be the largest controllable line. Every public declaration in the framework
generates Obj-C bridging metadata — class descriptors, selector tables, type information — and
the exporter is conservative: anything public in a module included in the framework is exported,
transitively, whether or not Swift uses it. Our shared module re-exported core:model and
core:network as api dependencies, so every DTO, every Ktor response wrapper and every
serialization descriptor became a bridged Obj-C class.
So the 11.2 MB decomposed into three parts with three different owners: a 7.9 MB runtime baseline, 2.7 MB of reachable code, and 0.6 MB of bridging metadata for an API surface nobody had chosen. Two of those three turned out to be movable, and the baseline was one of them.

The fix
Four changes, in the order they paid off. The largest one is the export surface, not the code.
1. Narrow what the framework exports. The default is "everything public, transitively". Naming the modules explicitly is the single biggest lever:
// shared/build.gradle.kts
kotlin {
    listOf(iosArm64(), iosSimulatorArm64()).forEach { target ->
        target.binaries.framework {
            baseName = "shared"

            // EXPLICIT export list. Without this, every `api` dependency's public surface is
            // bridged — including DTOs Swift never names. The default is transitive and
            // generous, which is the right default for correctness and the wrong one for size.
            export(projects.core.model)          // Swift genuinely needs these types
            // core:network and core:database are deliberately NOT exported: Swift talks to
            // the use cases, never to a Ktor response or a SQLDelight row.

            // Strip the metadata for declarations nothing outside Kotlin calls.
            freeCompilerArgs += listOf("-Xexport-kdoc=false")
        }
    }
}
And the dependency declarations that make that possible — the ones that had been api because
api is what makes a type visible to consumers, and visible-to-Kotlin-consumers is not the same
question as exported-to-Swift:
commonMain.dependencies {
    api(projects.core.model)                 // exported, intentionally
    implementation(projects.core.network)    // was api — Swift never names these types
    implementation(projects.core.database)   // was api
}
2. Mark the internal surface internal. The exporter honours internal, and a module's public
API accumulates by default:
// 61 declarations changed from public to internal, mechanically:
// anything not named in the framework's own API documentation or by an iOS source file.
internal class SyncScheduler(…)
internal fun DocDto.toDomain(): Doc = …
3. Bitcode and the size the store actually reports. The 30.7 MB figure is the archive; the download is thinned per device and recompressed, and these are different numbers that get conflated in review comments. Measuring the right one:
#!/usr/bin/env bash
# tools/ios-size-report.sh — the number the STORE reports, not the archive on disk.
#
# The archive contains every architecture and is not what a user downloads. App Store Connect
# thins per device and recompresses, and the delta between the two is large enough that
# optimising against the archive sends you after the wrong bytes.
set -euo pipefail
ARCHIVE="$1"

# A real thinning pass, locally, rather than reading the archive's byte count.
xcodebuild -exportArchive \
  -archivePath "$ARCHIVE" \
  -exportOptionsPlist tools/export-thinned.plist \
  -exportPath build/thinned >/dev/null

for ipa in build/thinned/*.ipa; do
  # The App Store applies its own compression; unzip-then-recompress approximates it far
  # better than the .ipa's own size, which is already compressed differently.
  tmp=$(mktemp -d); unzip -q "$ipa" -d "$tmp"
  raw=$(du -sk "$tmp" | cut -f1)
  comp=$(cd "$tmp" && zip -qr -9 - . | wc -c)
  printf "%-28s raw %6s KB   compressed %6s KB\n" \
    "$(basename "$ipa" .ipa)" "$raw" "$((comp / 1024))"
  rm -rf "$tmp"
done
4. Drop one dependency we were using for one function. SQLDelight was 1.4 MB and the module used it for a single cached table. It stayed — the alternative was hand-rolled SQL — but the measurement is what made that a decision rather than an accident.
And the output it produced, after 1 through 3:
$ ./gradlew :shared:linkReleaseFrameworkIosArm64
$ bash tools/ios-size-report.sh build/iosApp.xcarchive

iosApp-iPhone15              raw  40,112 KB   compressed  23,516 KB
                                                          ↑ was 30.7 MB

$ ls -lh shared.framework/shared
 4.1M  shared.framework/shared        # was 11.2M
The shared framework fell from 11.2 MB to 4.1 MB, and the store-reported download from 30.7 MB to 23.5 MB. Note that 4.1 MB is BELOW the 7.9 MB "floor" measured earlier, which is the result worth stating plainly: 7.9 MB was not a floor, it was the size of the runtime under a default export surface. Every exported declaration is a root the linker cannot strip from, so the empty-API framework was still retaining runtime code on behalf of metadata it was obliged to keep. Narrowing the exports did not just remove metadata — it let the linker strip code the metadata had been holding, including code inside the runtime itself. The framework is still 10× the Android figure, and that remainder is genuinely structural.
How we proved it
That the floor is the runtime and not our code — the measurement that redirected the whole investigation:
$ # a framework with one empty public object, no dependencies
$ ls -lh shared.framework/shared
 7.9M
$ nm shared.framework/shared | grep -c '^.* t _kfun:kotlin'
28,411
Twenty-eight thousand Kotlin runtime symbols in a framework exporting nothing.
That the export surface was retaining code, not just adding metadata. The test is to narrow the exports and measure the code sections separately from the metadata, because the two have different fixes:
$ size -m shared.framework/shared | grep -E '__text|__objc_const'

                 before narrowing    after
  __text           6,412,288          2,118,784       ← executable code
  __objc_const       628,944            104,320       ← bridging metadata
The metadata fell by 0.5 MB and the code fell by 4.1 MB. I had expected the opposite ratio, and it is why "it is only metadata" was the wrong model: an exported declaration is a root the linker cannot strip from, so the metadata was holding 4 MB of reachable code.
That internal is doing real work and not just tidying. Reverting the 61 declarations alone,
with the explicit export list left in place:
public  (61 reverted)    5.8 MB
internal                 4.1 MB
And that the archive figure is the wrong one to optimise against. Both numbers, measured across the same four changes:
                    archive      store-reported download
before              30.7 MB      30.7 MB
after step 1        26.1 MB      24.9 MB
after step 2        25.4 MB      23.9 MB
after step 3        25.4 MB      23.5 MB       ← step 3 changed only the measurement
Step 3 moved the reported number by 0.4 MB without changing a byte of output, because it was the first time we had measured what the store charges for. A review comment citing the archive size and a review comment citing the download size are two different conversations.
What I cannot tell you is whether 7.9 MB is the floor on a current toolchain — it is the floor on the version we shipped, and the Kotlin/Native runtime's size has moved between releases in both directions. Re-measure it on your own toolchain before using it as a budget; the method transfers and the constant does not.
And one honest non-result. We tried splitting shared into two frameworks so that a rarely-used
feature could be lazily linked. Both frameworks carry the full runtime, so the total grew by 7.9 MB
rather than shrinking. One Kotlin framework per app is the shape that works.

What this generalizes to
The same artifact has a different cost on every platform it ships to, and the cost is set by what the platform already has rather than by what you wrote. On a platform that supplies the runtime, your module costs what it references; on one that does not, it costs a fixed floor plus what it references plus whatever the interop layer must describe. The practical consequence is that a size budget is per target and non-transferable, and that the first useful measurement is always the empty case — build the module with no feature code at all, and you learn which part of the number is yours to move.
Related
- A framework builds for one architecture. iOS consumers need an XCFramework — the packaging decision above this one, and why the simulator build is not the one to measure.
- Two Kotlin classes, one Objective-C name — the other cost of a generous export surface, this time a build failure rather than bytes.
Keep reading
One post a week on shipping mobile software. No digests, no course pitch. Subscribe.
One post a week, no digest
New writing when it lands. No roundups, no course pitch, no "10 tips".