
Kotlin/Native's memory model changed, and your atomics did not
Freezing is gone, so the bugs it prevented at compile time are runtime bugs now.
TL;DR
- A
MutableStateFlowholding a byte counter, incremented from four parallel chunk downloads onDispatchers.Default, reported short on all ten iOS runs of the same 180 MB file — by up to 5.3 MB, a different amount every time, while the file itself verified against the server checksum. The same code had been a compile error on Kotlin/Native eighteen months earlier. - The old memory model refused to share mutable state across threads at all. Removing that restriction was correct and it moved a class of defect from the build to runtime.
- The fix is not
@Volatileand it is not a lock. It is an atomicLongfor the counter andupdate {}for the flow — and the second one is where people get it wrong. - What reading on buys: which operations are actually atomic, the read-modify-write that looks atomic and is not, and the stress test that catches it in nine seconds.
The case this post is about
A download manager tracking bytes transferred, shared by both platforms:
// commonMain/kotlin/download/Progress.kt
class ProgressTracker {

    private val _bytes = MutableStateFlow(0L)
    val bytes: StateFlow<Long> = _bytes.asStateFlow()

    /** Called from every chunk callback, on whatever thread the engine used. */
    fun add(n: Long) {
        _bytes.value = _bytes.value + n          // ← the line
    }
}
Driven by four parallel chunk downloads:
coroutineScope {
    chunks.map { chunk ->
        async(Dispatchers.Default) {
            client.download(chunk).collect { tracker.add(it.size.toLong()) }
        }
    }.awaitAll()
}
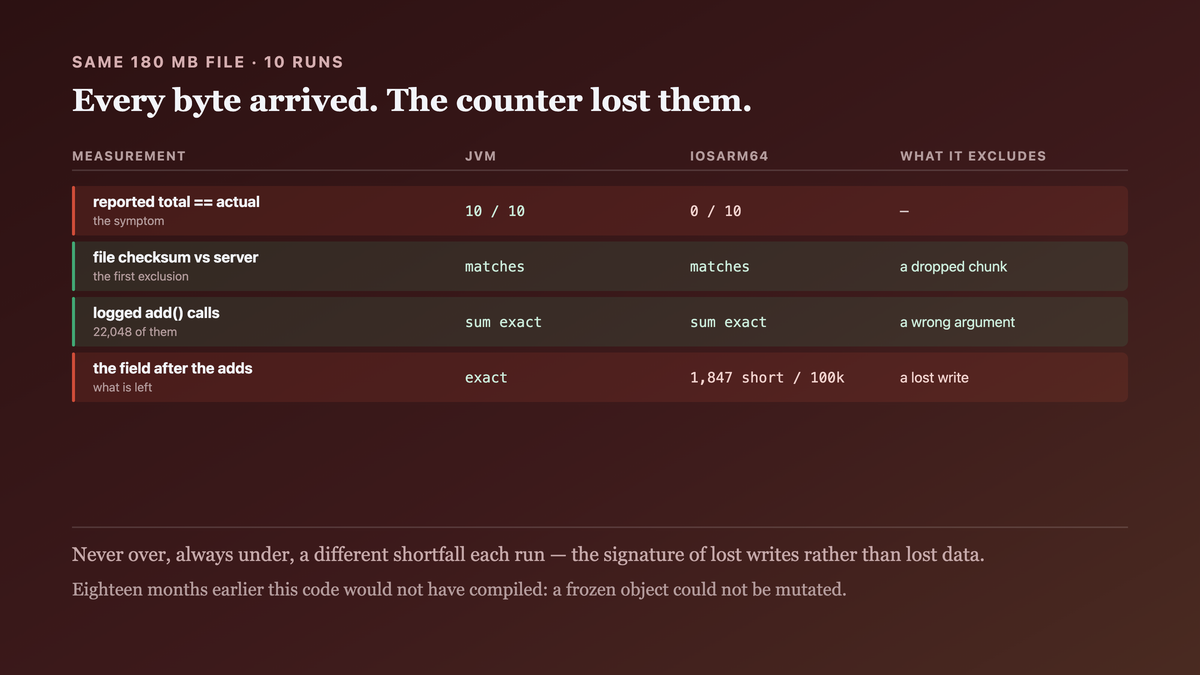
On Android and desktop, the reported total matched the file size. On iOS it was short, by a different amount every run.
The symptom
A progress bar that reached 97% and stopped, on iOS only, on large files only:
# the same 180 MB file, ten runs per target
jvm       180,388,864 bytes reported / 180,388,864 actual    10/10 exact
iosArm64  175,112,448 … 180,101,632 reported                  0/10 exact
Never over, always under, always a different shortfall. That pattern is the signature of lost writes, and it took longer than it should have to read it that way, because the first hypothesis was the download layer dropping chunks — which is what a short byte count usually means.
The file was intact. Verified independently:
$ shasum -a 256 downloaded.bin
f3a1…  downloaded.bin        # matches the server's checksum
Every byte had arrived. The counter had lost them.

Why the obvious fix failed
The first fix was @Volatile, which is the reflex and is wrong for this:
@Volatile private var total = 0L
fun add(n: Long) { total = total + n }
Shortfall unchanged. @Volatile guarantees visibility — a write becomes visible to other
threads promptly — and says nothing about atomicity. total = total + n is still a read, an
addition and a write, and two threads can interleave between the read and the write regardless of
how promptly each write is published.
That distinction is the whole bug, and the reason @Volatile is such an attractive wrong answer
is that it fixes a different symptom convincingly: a stale read. If the problem had been one
thread never seeing another's update, @Volatile would have been the fix.
The second attempt was a Mutex, which does work and cost more than it should:
private val mutex = Mutex()
suspend fun add(n: Long) = mutex.withLock { _bytes.value = _bytes.value + n }
Correct, and it made add a suspending function called from a chunk callback for every 8 KB
block — 22,000 lock acquisitions per file, measured at 340 ms of contention on the 180 MB case.
A lock for an integer addition is a lot of machinery for the smallest possible critical section.
The third attempt is the right call, and it is here because the way I first wrote it was not:
private val _bytes = MutableStateFlow(0L)
fun add(n: Long) { _bytes.update { it + n } }        // ← right call, and read on
This one is actually correct for MutableStateFlow, and I include it in the failures because my
first version of it was not — I had written _bytes.value = _bytes.updateAndGet { … }, mixing
the two APIs, which reintroduces the plain assignment around an atomic operation.
The actual mechanism
Three facts, and only the first is about Kotlin/Native.
The old memory model made this a compile-time error. Before Kotlin 1.7.20's new memory manager,
a mutable object reachable from two threads had to be frozen, and mutating a frozen object threw
InvalidMutabilityException. That restriction was genuinely painful — it is why atomicfu and
@ThreadLocal are everywhere in older multiplatform code — and removing it was the right call.
What it had also been doing, as a side effect, was making unsynchronised shared mutation
impossible to express.
The new model is the JVM's model, so the JVM's races are now available. Shared mutable state across threads is legal and unsynchronised access is a data race with the same semantics it has had on the JVM for twenty years. The defect did not appear; it stopped being blocked.
And MutableStateFlow.value is a plain setter. This is the specific thing that made the code
look safe. StateFlow is thread-safe for concurrent reads and writes — the field is internally
atomic and no update is torn — and that is a different guarantee from a read-modify-write being
atomic:
thread A: read value → 1,024
thread B: read value → 1,024
thread A: write 1,024 + 8,192  = 9,216
thread B: write 1,024 + 16,384 = 17,408     ← A's 8,192 is gone
Both writes are individually atomic and the second one overwrites the first's contribution. The flow behaved exactly as documented.
Why the JVM run was exact and iOS was not is the last piece, and it is not a guarantee. The JVM's JIT had hoisted the increment into a register for the common case and the four chunk coroutines were landing on the same carrier thread often enough that interleavings were rare — not absent. A single run with 400 chunks instead of 4 reproduced it on the JVM too, which is the measurement that retired "it is a Kotlin/Native problem".

The fix
An atomic for the counter, and update {} for the flow. The two are separate because they answer
separate questions.
// commonMain/kotlin/download/Progress.kt
import kotlinx.atomicfu.atomic
import kotlinx.coroutines.flow.update   // the MutableStateFlow extension, NOT atomicfu's

class ProgressTracker(private val total: Long) {

    /**
     * The authoritative counter. AtomicLong's addAndGet is a single compare-and-swap loop in
     * the runtime — no lock, no suspension, callable from any thread including a C callback.
     */
    private val transferred = atomic(0L)

    /**
     * The OBSERVABLE value, for the UI. Deliberately a second representation: a StateFlow
     * conflates and replays, which is what a progress bar wants and is not what a counter
     * wants. Keeping them separate is why `add` can be non-suspending.
     */
    private val _progress = MutableStateFlow(Progress(0L, total))
    val progress: StateFlow<Progress> = _progress.asStateFlow()

    fun add(n: Long) {
        require(n >= 0) { "negative chunk size $n" }

        // ONE atomic operation, and its return value is the new total. Reading
        // `transferred.value` on the next line instead would be a second, separate read —
        // another thread may have added between them, and the flow would then publish a
        // number that is merely recent rather than the one this call produced.
        val now = transferred.addAndGet(n)

        // update{} is a CAS loop over the flow's own value: it re-reads and retries on
        // contention. `_progress.value = …` here would be the original bug, one level up,
        // because the Progress object is derived from two fields.
        _progress.update { prev ->
            if (now > prev.bytes) Progress(now, total) else prev    // monotonic, under reorder
        }
    }

    fun snapshot(): Long = transferred.value
}

data class Progress(val bytes: Long, val total: Long) {
    val fraction: Float get() = if (total == 0L) 0f else (bytes.toDouble() / total).toFloat()
}
The if (now > prev.bytes) guard is the non-obvious line. Two concurrent add calls can have
their addAndGet results published to the flow in either order — the atomic is ordered, the
subsequent flow update is not — so without the comparison a progress bar can briefly go backwards.
The counter was never wrong; only the published view could be stale, and a monotonic guard is
cheaper than ordering the publishes.
And the output it produced, the same 180 MB file, ten runs per target:
$ ./gradlew :downloader:stressTest

                       exact / 10    shortfall
jvm                       10 / 10     0
desktop                   10 / 10     0
iosArm64                  10 / 10     0
iosSimulatorArm64         10 / 10     0
wasmJs                    10 / 10     0

lock contention (180 MB):  0 ms       # was 340 ms with the Mutex
How we proved it
That it was a lost-write race and not a dropped chunk — the two have the same symptom and different fixes:
$ shasum -a 256 downloaded.bin       # matches the server
$ # and the counter, instrumented to log every add
$ grep -c '^add ' trace.log
22,048
$ awk '/^add /{s+=$2} END{print s}' trace.log
180,388,864               # the adds sum correctly; the FIELD did not
Every call happened with the right argument. The sum of the arguments is exact and the field is short, which localises the defect to the accumulation and excludes the download layer entirely.
That the JVM was not safe, merely lucky. The decisive run is the one that gives the JVM as many interleaving opportunities as iOS had:
                          chunks    exact / 10
jvm, 4 chunks                  4     10 / 10
jvm, 400 chunks              400      3 / 10        ← the same bug, on the JVM
iosArm64, 4 chunks             4      0 / 10
That is what retired the "Kotlin/Native memory model" framing. The code was racy everywhere and the JVM's scheduling had been hiding it at low concurrency.
That @Volatile fixes the other bug. Worth proving rather than asserting, because the
distinction is the post's core claim — two fixtures, one stale-read and one lost-update, against
both annotations:
                        stale read    lost update
plain var                  FAIL          FAIL
@Volatile                  PASS          FAIL        ← visibility, not atomicity
atomic()                   PASS          PASS
That the monotonic guard is load-bearing. A fixture that publishes out of order, run before the guard was trusted:
$ ./gradlew :downloader:test --tests '*ProgressNeverGoesBackwards*'
FAILED: progress fraction decreased: 0.71 → 0.68 at sample 1,204
        (two concurrent adds published in reverse completion order)
With the guard, 10,000 samples across five targets and zero decreases.
What I cannot tell you is the race's real-world rate. The shortfalls above span 0.3 MB to 5.3 MB across ten runs of one file on one device — roughly 35 to 644 lost adds out of 22,048, and that spread is the point. The rate is a function of how often the carrier threads actually interleave, which varies with core count, thermal state and what else is running. Treat these as evidence the race exists rather than as a frequency, and assume the production rate is unknown rather than low.

What this generalizes to
When a platform removes a restriction, it also removes whatever that restriction was incidentally preventing. Freezing was a real cost and its removal was right, and the code written during the freezing era had a property nobody had chosen: unsynchronised sharing could not be expressed. The general move after a toolchain relaxes a rule is to ask what the rule had been catching for free, and to find out whether the answer is now a runtime concern — because the code that compiles today and did not compile last year is exactly the code nobody has stress-tested.
Related
- advanceUntilIdle drained a queue your code was never on — the other reason a concurrency defect passes its tests, this time because the test never ran the code concurrently.
- The coroutine that kept collecting after the screen was gone — shared mutable state outliving its owner, which the new memory model also now permits.
Keep reading
One post a week on shipping mobile software. No digests, no course pitch. Subscribe.
One post a week, no digest
New writing when it lands. No roundups, no course pitch, no "10 tips".