
The queue had no maximum, so the failure was memory and not latency
An unbounded buffer converts a throughput problem into an out-of-memory crash.
TL;DR
An unbounded queue does not remove a throughput limit; it hides one. When producers outpace consumers, the backlog grows until the process runs out of memory — so a problem that should have surfaced as "requests are slow" surfaces as a crash, and the crash loses everything in the buffer.
Ours was an analytics event buffer: Channel(Channel.UNLIMITED). During a downstream slowdown it
grew to 4.1 million events, the pod was OOM-killed, and 4.1 million events were lost — including
the ones that would have told us what happened.
Bound every queue. The bound forces you to answer the question an unbounded queue lets you avoid: when the buffer is full, who waits and what gets dropped?
The case this post is about
An analytics pipeline with an in-process buffer between request handling and the upstream sink:
class AnalyticsBuffer(private val sink: AnalyticsSink, scope: CoroutineScope) {

    private val channel = Channel<Event>(Channel.UNLIMITED)     // ← no bound

    init {
        scope.launch {
            channel.consumeAsFlow().chunked(500).collect { batch ->
                sink.send(batch)                                 // network, ~80ms per batch
            }
        }
    }

    // called from request handlers. Must not block them.
    fun record(event: Event) { channel.trySend(event) }
}
The reasoning was explicit and reasonable: analytics must never slow down a user request, so the producer must not block, so the queue must never be full, so make it unlimited.
The symptom
14:20  upstream analytics sink p99 80ms → 4.2s  (provider incident)
14:21  consumer throughput  6,200 ev/s → 120 ev/s
14:21  producer rate unchanged: ~5,800 ev/s
14:24  heap 1.2GB → 3.8GB
14:31  Killed process (OOM)
14:31  events in the buffer at death: ~4,100,000  — all lost
14:31  pod restarts, buffer empty, begins filling again
14:38  OOM
14:45  OOM                               ← a crash loop driven by the backlog
The losses were not just analytics:
14:31 – 14:52
  OOM kills:                          4
  in-flight HTTP requests dropped:  ~1,900   (the pod died mid-request)
  analytics events lost:           ~16,400,000
  time without any telemetry:        21 min   ← during the incident
The last line is the one that hurt. The thing that would have explained the incident was in the buffer that died.
And the memory graph was the only honest signal. Latency looked fine, because trySend on an
unlimited channel always returns immediately. The service reported healthy throughput right up to
the kill.
14:20  p99 request latency  48ms
14:30  p99 request latency  51ms       ← one minute before OOM
Why the obvious fix failed
"Increase the memory limit." We went from 4GB to 8GB. The OOM moved from 11 minutes into the incident to 23 minutes, and the loss doubled. More headroom buys time and converts a smaller loss into a bigger one.
"Add a size check in record." Our first real attempt:
fun record(event: Event) {
    if (channel.size < 100_000) channel.trySend(event)      // drop above the threshold
}
Better — and it drops the newest events, which are the most diagnostically valuable during an
incident, and Channel.size on an unlimited channel is an O(1) estimate we were treating as a
decision input without thinking about it.
"Spill to disk when the buffer is large." Converts an OOM into a disk-full, with more code. It is the right answer for an outbox that must not lose data; for analytics it is disproportionate.
"Scale up the consumer." The consumer was not the constraint. The upstream sink was, and no amount of local concurrency makes someone else's API faster.
The actual mechanism
A queue between a producer and a consumer has one job: absorb transient rate differences. It cannot absorb a sustained one.
producer 5,800 ev/s, consumer 120 ev/s
  → backlog grows at 5,680 ev/s
  → ~600 bytes/event
  → 3.4 MB/s of heap growth, forever
The word carrying the weight there is forever. An unbounded queue does not have a failure threshold it crosses under load — it has no stable state at all when the rates differ, so the only question is how long until the process dies. At 3.4 MB/s a 4 GB heap buys about twenty minutes, and the identical code with a 16 GB heap buys eighty: the same defect, rescheduled.
That is why "give it more memory" felt like it worked for a week. It moved the failure far enough out that it stopped correlating with any deploy, which made it look like an environmental problem rather than an arithmetic one.
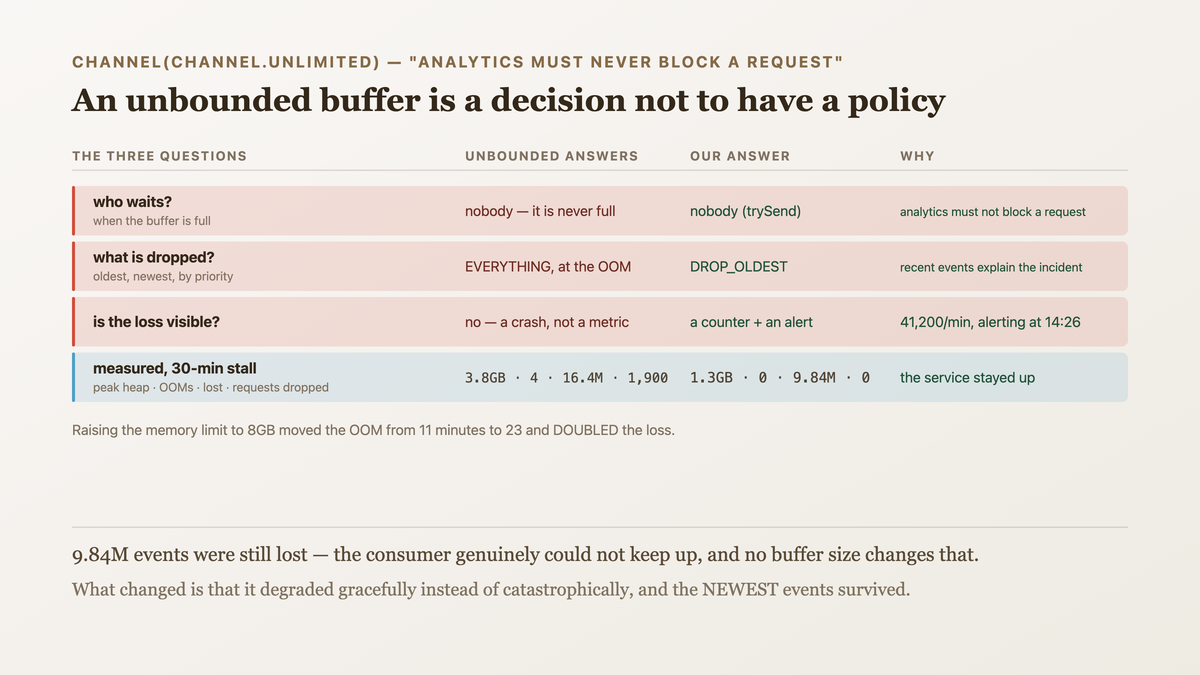
An unbounded queue means "I decline to decide what happens when the consumer cannot keep up", and the system decides for you: it crashes, and the crash discards the entire buffer at once.
A bound forces three decisions you otherwise never make:
Who waits. If the buffer is full, does the producer block (backpressure) or proceed?
What is dropped. Oldest, newest, or by priority?
And is the loss visible? A silent drop is indistinguishable from "nothing happened".
Those three are the actual design, and the unbounded version has none of them. Worse, it converts a graceful degradation (some events lost, service fine) into a catastrophic failure (all events lost, service dead, requests dropped).

An unbounded buffer is a decision not to have a policy. The system still has one — crash and lose everything — and it is the worst available policy.
The fix
A bounded queue, dropping the oldest, with the loss counted and the consumer protected.
class AnalyticsBuffer(private val sink: AnalyticsSink, scope: CoroutineScope) {

    // BOUNDED. 50,000 × ~600B ≈ 30MB, and at 6,200 ev/s it absorbs ~8s of
    // consumer stall — which covers every normal blip we have measured.
    private val channel = Channel<Event>(
        capacity = 50_000,
        onBufferOverflow = BufferOverflow.DROP_OLDEST,   // keep the NEWEST events
    )

    private val dropped = AtomicLong()

    init {
        scope.launch {
            channel.consumeAsFlow()
                .chunked(500)
                .collect { batch ->
                    // the sink call is bounded, so one slow batch cannot stall forever
                    runCatching { withTimeout(10.seconds) { sink.send(batch) } }
                        .onFailure { metrics.counter("analytics_batch_failed").inc() }
                }
        }
        // the loss is REPORTED, not silent
        scope.launch {
            while (true) {
                delay(10.seconds)
                val n = dropped.getAndSet(0)
                if (n > 0) metrics.counter("analytics_events_dropped").inc(n)
            }
        }
    }

    fun record(event: Event) {
        // never blocks a request handler — that requirement was always correct
        val sent = channel.trySend(event).isSuccess
        if (!sent) dropped.incrementAndGet()
    }
}
Five decisions, each one of the three questions answered explicitly:
Who waits: nobody. trySend from a request handler, as before. For analytics, blocking a user
request to record an event is the wrong trade, and now that is a stated choice rather than an
implication of an unlimited buffer.
What is dropped: the oldest. DROP_OLDEST is the opposite of my first attempt and is right for
diagnostics — during an incident the recent events are the ones that explain it. For an audit log
the answer would be DROP_LATEST plus a refusal, because losing old records silently is worse.
The loss is counted and alerted:
- alert: AnalyticsEventsDropped
  expr: rate(analytics_events_dropped[5m]) > 0
  for: 2m
  labels: { severity: ticket }
A dropped event is now a visible, quantified degradation instead of an invisible one.
The capacity is derived, not guessed. 50,000 events at ~600 bytes is ~30MB, and at the observed production rate it absorbs about eight seconds of consumer stall — which covers the p99 of every blip in six months of history. The comment records the arithmetic so the next person can re-derive it.
And the sink call has a timeout, so a single hung batch cannot stop the consumer permanently — which is what turned a slow upstream into a complete stall.
For the queues where loss is unacceptable, the answer is different:
// an outbox for payment events: bounded, and the producer BLOCKS rather than drops.
private val outbox = Channel<PaymentEvent>(capacity = 1_000)      // suspends when full
suspend fun record(e: PaymentEvent) = outbox.send(e)              // backpressure, deliberately
Backpressure propagates the slowdown to the caller, which is correct when the data matters more than the latency. Choosing per queue is the point.
How we proved it
Memory under a sustained consumer stall, which is the whole claim:
upstream sink forced to 4.2s p99 for 30 minutes
                        peak heap   OOM kills   events lost   requests dropped
unbounded                  3.8GB         4      16,400,000          1,900
unbounded + 8GB limit      7.9GB         3      31,100,000          2,400
bounded 50k, DROP_OLDEST   1.3GB         0       9,840,000              0
Nine point eight million events still lost — the consumer genuinely could not keep up for thirty minutes, and no buffer size changes that. What changed is that the service stayed up, no requests were dropped, and the most recent events survived.
That the newest events survive, which is the diagnostic value:
events present in the sink for the final 60s of the stall
  DROP_LATEST (my first attempt):      0
  DROP_OLDEST:                    38,400
That the drop is visible:
analytics_events_dropped, during the stall
  14:22   0
  14:24   41,200/min        ← alert fires at 14:26
The counter is what turned "something is wrong, no telemetry" into "the analytics consumer is behind, here is by how much".
And a load test that bounds the memory claim:
@Test
fun bufferMemoryIsBoundedUnderASustainedStall() = runTest {
    val buffer = AnalyticsBuffer(StalledSink(), backgroundScope)
    repeat(5_000_000) { buffer.record(event(it)) }
    advanceUntilIdle()
    assertTrue(buffer.queuedCount() <= 50_000)
}
unbounded:  FAILED — 5,000,000 queued
bounded:    PASSED — 50,000
One limit worth being direct about: DROP_OLDEST is correct for analytics and would be a data-loss
bug for anything transactional. We audited the service's other six queues and changed two to
bounded-with-backpressure instead, because their contents could not be dropped at all. There is no
single right policy — the point is that every queue needs one chosen deliberately, and four of ours
had none.
What this generalizes to
An unbounded buffer is a missing policy, and the default policy is "crash". Queues, channels, caches without eviction, retry backlogs, log buffers, connection pools without a maximum. Each unbounded resource converts a capacity problem into an availability failure.
Bounding forces three decisions: who waits, what is dropped, and is it counted. These are the real design questions. An unbounded buffer lets you ship without answering them, and the answers you get by default are the worst ones.
Graceful degradation beats catastrophic failure, and the difference is a bound. Losing 10% of analytics while serving every request is a good day. Losing 100% plus the service plus 1,900 in-flight requests is the same underlying problem with no policy.
Drop direction depends on what the data is for. Newest matters for diagnostics; oldest matters for audit. Getting it backwards — as I did first — means the surviving data is the least useful subset, which is a silent and specific kind of wrong.
Related
- The health check that returned 200 while the service was useless — the other invisible-failure shape
- Every timeout you set independently adds up to one that is wrong — the sink timeout this needed
- Running a model on-device is a memory decision first — memory as the binding constraint
Keep reading
This is part of 100 practices of senior engineers — the habits that separate five years of experience from one year five times. Follow MobileByteSensei for the rest.
One post a week, no digest
New writing when it lands. No roundups, no course pitch, no "10 tips".