
Running a model on-device is a memory decision first
Quantisation, mmap and the low-memory killer decide whether your 3B model ships.
TL;DR
Every on-device inference discussion starts with latency, because latency is easy to measure. The thing that decides whether you can ship is memory — specifically, how much your process is holding when the user switches to another app and the OS decides who to kill.
Our 3B model at 4-bit was 1.9GB of weights. Loaded into the heap, the app was killed on backgrounding on every device under 6GB of RAM, and the kill rate showed up as a retention regression rather than as a crash, because a killed background process is not a crash.
Memory-map the weights, measure the kill rate per device tier, and let the OS reclaim pages instead of killing your process.
The case this post is about
An on-device summarisation feature: a 3B parameter model, 4-bit quantised, running locally for privacy reasons.
class Summarizer(context: Context) {
    private val interpreter: Interpreter = Interpreter(
        loadModelFile(context, "model-3b-q4.tflite"),     // reads into a ByteBuffer
        Interpreter.Options().apply { numThreads = 4 },
    )

    private fun loadModelFile(ctx: Context, name: String): ByteBuffer {
        val fd = ctx.assets.openFd(name)
        val bytes = fd.createInputStream().readBytes()     // ← 1.9GB into the heap
        return ByteBuffer.allocateDirect(bytes.size).put(bytes)
    }

    fun summarize(text: String): String { … }
}
Latency was benchmarked carefully and was fine:
Pixel 8 Pro    first token 410ms    28 tok/s
Pixel 6a       first token 890ms    11 tok/s
Both acceptable for a summarisation feature. We shipped to 10%.
The symptom
Not a crash — a retention drop:
10% rollout, week 1
  D1 retention   control 71.2%   treatment 64.8%   (−6.4pp)
  crash-free rate  99.81%          99.79%           (no change)
A six-point retention regression with no crashes, which is the signature of something that looks like the app "just closing".
The real signal was in the OS, not in our telemetry:
$ adb shell dumpsys activity processes | grep -A2 com.example
  Proc # 8: cached  oom_adj=985  com.example  (pss=2,140,880kB)

$ adb logcat | grep lowmemorykiller
  lowmemorykiller: Kill 'com.example' (12401), uid 10298, oom_adj 985 to free 2088960kB
2.1GB resident, killed on backgrounding.
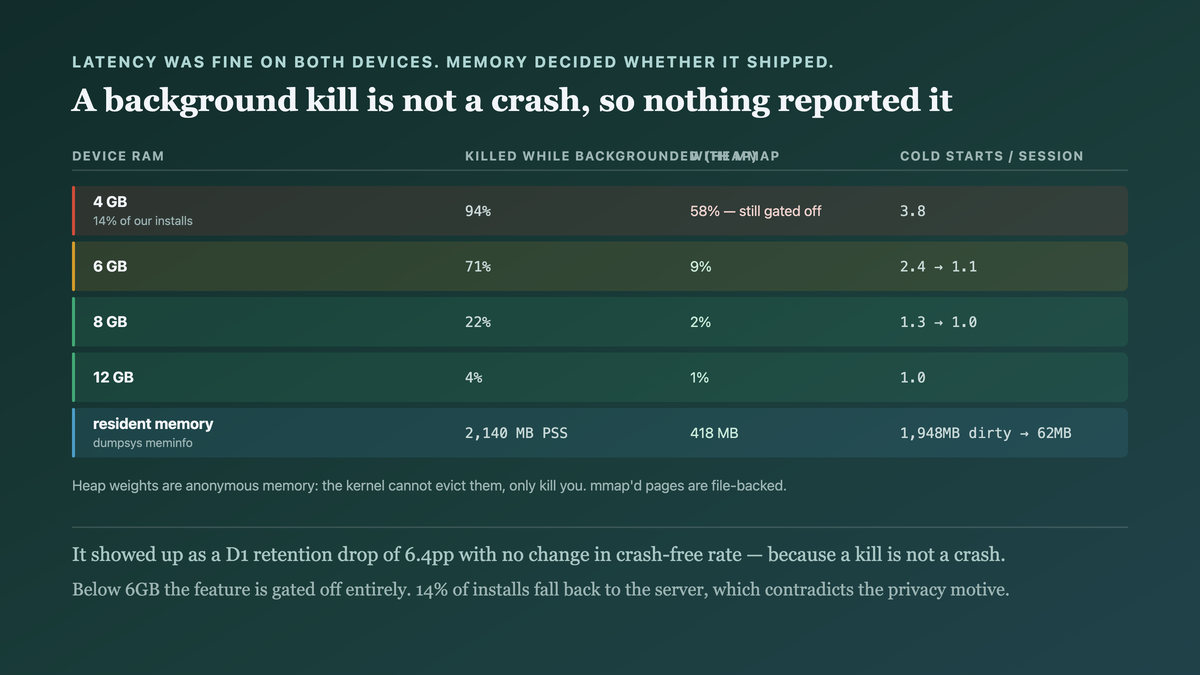
Measured by device RAM tier:
device RAM   sessions   killed while backgrounded   cold starts / session
  4 GB         18,200            94%                      3.8
  6 GB         31,400            71%                      2.4
  8 GB         22,900            22%                      1.3
 12 GB          8,100             4%                      1.0
On a 4GB device the app was killed almost every time the user switched away. Each return was a cold start, which meant reloading 1.9GB, which took 4–7 seconds — so the user experience was "the app restarts constantly and is slow", reported as neither a crash nor a performance bug.
And the latency numbers were still correct. Nothing we had measured was wrong; we had measured the wrong thing.
Why the obvious fix failed
"Use a smaller model." The obvious lever, and it costs quality. A 1B model at 4-bit is 620MB and summarised noticeably worse — our quality eval dropped from 4.1 to 3.2 on a 5-point scale. Worth knowing as an option, not a free win.
"Quantise harder." 3-bit took it to 1.5GB and degraded quality similarly. Quantisation below 4-bit was not a good trade for this model.
"Release the interpreter when backgrounded." We did, and it is part of the final answer — on its own it means every foreground return reloads 1.9GB from assets, a 4–7 second stall. It converts kills into slow resumes.
"Ask for a larger heap." android:largeHeap="true" raises the limit and does nothing about the
low-memory killer, which looks at total PSS and not at the heap limit. This is the fix that feels
like it should work and addresses a different constraint entirely.
The actual mechanism
Three facts that interact.
The OS kills by memory pressure, ranked by oom_adj. A backgrounded app is a cached process
with a high (killable) score, and the kernel picks the largest reclaimable process first. Holding
2.1GB makes you the obvious candidate.
Heap-allocated weights are not reclaimable. A ByteBuffer.allocateDirect holding 1.9GB is
anonymous memory. The kernel cannot evict it to make room; it can only kill the process.
Which is why the symptom is so consistently misread. The app is killed while backgrounded and
idle — it is not allocating, not inferring, not doing anything — so the crash looks unrelated to
the model. There is no OutOfMemoryError, no exception, and frequently no crash report at all,
because SIGKILL leaves no opportunity to write one. What the user experiences is the app
"restarting from scratch" after they check a message, and what the logs show is a cold start with
nothing before it.
That absence of evidence is the diagnostic. A crash that produces a stack trace is a defect in your code; a process that vanishes with no trace during backgrounding is almost always the OS reclaiming it, and the thing to measure is not your allocations but your resident set relative to the device — which is the input the kernel is actually ranking on.
Memory-mapped weights are reclaimable. mmap of a file maps pages backed by storage. Under
pressure the kernel evicts clean pages and re-reads them on access, so your process shrinks instead
of dying. Resident set becomes "whatever is hot" rather than "everything".
That distinction is the whole post:
heap-loaded 1.9GB  →  PSS 2.1GB  →  largest cached process  →  killed
mmap'd 1.9GB       →  PSS ~380MB resident (hot pages)       →  pages evicted, process survives

Latency is what you measure in a benchmark. Resident memory while backgrounded is what decides whether the feature ships, and it is invisible to every latency test.
The fix
Memory-map the weights, stage the model outside the APK, and measure the kill rate as a first-class metric.
class Summarizer(private val context: Context) {

    // 1. mmap, not read-into-heap. File-backed pages are reclaimable.
    private val interpreter: Interpreter by lazy {
        val file = ensureModelStaged()           // see below
        val channel = FileInputStream(file).channel
        val mapped = channel.map(FileChannel.MapMode.READ_ONLY, 0, channel.size())
        Interpreter(mapped, Interpreter.Options().apply {
            numThreads = 4
            useNNAPI = true                      // delegate where available
        })
    }

    // 2. assets are compressed in the APK and cannot be mapped — stage once to files/
    private fun ensureModelStaged(): File {
        val out = File(context.filesDir, "model-3b-q4.tflite")
        if (out.exists() && out.length() == EXPECTED_BYTES) return out
        context.assets.open("model-3b-q4.tflite").use { input ->
            out.outputStream().use { input.copyTo(it) }
        }
        return out
    }
}
Four decisions:
channel.map instead of readBytes. The single change that fixes the kill rate. The weights
become file-backed pages the kernel can evict.
The model is staged to filesDir once. APK assets are stored compressed, so they cannot be
mapped directly — the one-time copy is the price of mmap, and it runs on first launch.
android:extractNativeLibs and the asset packing matter here too; for a model this size, an
asset pack downloaded on demand is better than shipping 1.9GB in the APK:
install size
  model in the APK:        2.1 GB   ← above the Play delivery limit for many configurations
  on-demand asset pack:    180 MB base + 1.9GB fetched on feature first use
And a device-tier gate, because mmap does not make a 4GB device sufficient:
fun isSupported(context: Context): Boolean {
    val mi = ActivityManager.MemoryInfo().also {
        context.getSystemService(ActivityManager::class.java).getMemoryInfo(it)
    }
    return mi.totalMem >= 6L * 1024 * 1024 * 1024 && !mi.lowMemory
}
Below 6GB the feature falls back to server-side summarisation. That is a product decision, made from the kill-rate table rather than from a guess.
Then the metric that should have existed from the start:
// on every cold start, report whether the previous session was killed
val wasKilled = !prefs.getBoolean("clean_exit", true)
analytics.log("session_start", mapOf(
    "previous_session_killed" to wasKilled,
    "device_ram_gb" to totalMemGb,
    "model_resident_mb" to debugPss(),
))
How we proved it
Resident memory, measured rather than estimated:
$ adb shell dumpsys meminfo com.example | grep -E 'TOTAL PSS|Private|Mapped'
                      heap-loaded    mmap'd
TOTAL PSS               2,140 MB      418 MB
Private Dirty           1,948 MB       62 MB
Mapped (clean)              12 MB    1,904 MB
The weights moved from private-dirty (unreclaimable) to mapped-clean (evictable). That table is the fix.
Kill rate by device tier, same 10% cohort after the change:
device RAM   killed while backgrounded (before → after)
  4 GB              94%  →  58%     ← still bad; now gated off
  6 GB              71%  →   9%
  8 GB              22%  →   2%
 12 GB               4%  →   1%
4GB devices improved and stayed unacceptable, which is why the gate exists rather than relying on mmap alone.
Retention, after mmap plus the 6GB gate:
                control   treatment
D1 retention     71.2%     70.9%     (−0.3pp, within noise)
D7 retention     48.6%     49.4%     (+0.8pp)
And latency, to confirm mmap did not cost what it might have:
                 heap-loaded    mmap'd (warm)   mmap'd (after eviction)
first token        410ms           445ms             1,180ms
subsequent tok/s      28              28                 28
cold model load    4,900ms           210ms                —
Three things in that table. Warm first-token is 35ms slower — the page-fault cost on first touch. After eviction it is 1.18s, because pages are re-read from storage: a real regression in the worst case, and far better than a process kill. And cold load dropped from 4.9s to 210ms, because mmap does not read the file upfront.
One limit, stated plainly: the 58% kill rate on 4GB devices means we did not ship the feature there, and roughly 14% of our install base is below 6GB. That is a capability gap, not a solved problem — those users get server-side summarisation, which contradicts the privacy motivation that justified on-device inference in the first place. We accepted it; a smaller model for that tier is the obvious next step and would reopen the quality trade.
What this generalizes to
Benchmark the constraint that decides shipping, not the one that is easy to measure. Latency is measurable in a loop on a desk. Memory pressure needs a backgrounded app on a real low-RAM device, so it gets measured last or not at all — and it is usually the binding constraint for on-device inference.
File-backed memory is reclaimable; heap memory is not. This distinction governs mmap versus read, page cache versus application cache, and shared libraries versus static linking. When a system is under memory pressure, what it can evict matters more than what you have allocated.
A process kill is not a crash, so your crash reporting will not see it. Any failure mode the OS handles on your behalf — background kill, task termination, container eviction — is invisible to error monitoring and shows up as a behavioural metric. Instrument it directly.
Segment by device capability and be explicit about who is excluded. The kill-rate-by-RAM table turned "does this work" into "it works above 6GB". Shipping to the devices that can run it, with a named fallback, beats shipping to everyone and regressing retention.
Related
- Streaming a response changes your UI contract, not just your latency — the UI side of local inference
- Image loading is the least portable thing in your shared UI — the other memory-pressure source
- Wasm has no threads, and that decides your dispatcher — platform constraints that decide architecture
Keep reading
This is part of On-device & local models — what actually runs on a phone, measured on real hardware. Follow MobileByteSensei for the rest.
One post a week, no digest
New writing when it lands. No roundups, no course pitch, no "10 tips".