
The health check that returned 200 while the service was useless
Proving the process is running keeps a broken instance in the load balancer.
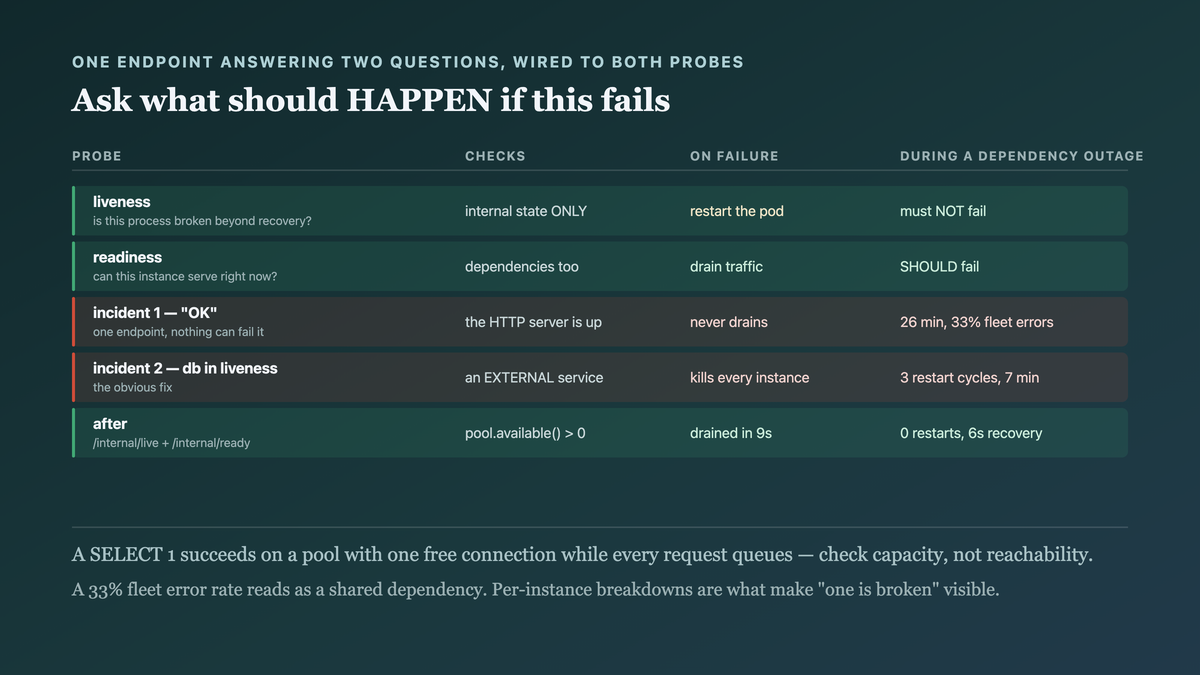
TL;DR
@Get("/health") fun health() = "OK"
That endpoint proves one thing: the HTTP server is accepting connections. It cannot fail while the process is alive, which means it cannot remove a broken instance from rotation — and a broken instance in rotation is worse than a dead one, because the load balancer keeps sending it traffic.
Ours returned 200 for 26 minutes while every request failed, because the database connection pool had been exhausted by a connection leak. The instance was healthy by its own definition and useless by every other.
Check the dependencies you cannot work without. Separate liveness from readiness, because they answer different questions and have opposite failure responses.
The case this post is about
A service behind a load balancer, with the health endpoint every service starts with:
@Get("/health")
fun health(): HttpResponse = HttpResponse.ok("OK")
# kubernetes
livenessProbe:  { httpGet: { path: /health, port: 8080 }, periodSeconds: 10 }
readinessProbe: { httpGet: { path: /health, port: 8080 }, periodSeconds: 5 }
One endpoint, both probes. This is the default in most templates.
The symptom
09:14:02  instance-7: connection pool exhausted (leak in a new code path)
09:14:02  instance-7: 100% of requests → 500
09:14:05  instance-7: GET /health → 200          ← still "healthy"
09:14:05  load balancer: instance-7 in rotation
…
09:40:11  on-call manually drains instance-7
Twenty-six minutes. The load balancer sent instance-7 one-third of all traffic, and one-third of all requests failed, while every automated system reported the fleet as healthy.
Three instances, one broken, and the aggregate hid it:
09:14 – 09:40
  fleet error rate         33.4%
  instance-7 error rate   100%
  instance-8 error rate     0%
  instance-9 error rate     0%
  healthy instances (per the probe)   3 / 3
The error-rate alert did fire at 09:16 — and it pointed at the fleet, so the first fifteen minutes went into "which dependency is down", because a 33% error rate across three instances looks like a shared dependency, not one bad instance.
And then the second incident, from the fix. Someone added a database check to /health:
@Get("/health")
fun health(): HttpResponse =
    if (db.ping()) HttpResponse.ok("OK") else HttpResponse.serverError()
The database had a 40-second blip. Every instance failed its liveness probe, so Kubernetes killed all of them, simultaneously, repeatedly:
11:02:10  db unreachable (40s)
11:02:20  all 3 instances fail livenessProbe
11:02:30  all 3 killed and restarted
11:02:50  db recovers; instances still cold-starting
11:03:40  3rd restart cycle — cold starts take 35s and the probe grace was 20s
11:09:00  crash loop broken manually
A seven-minute outage caused by a correct health check wired to the wrong probe.
Why the obvious fix failed
"Check the database in /health." The second incident. Liveness answers "should I be killed",
and a shared dependency being briefly unavailable is not a reason to kill every instance — it is a
reason to stop sending them traffic.
"Add more checks to the same endpoint." More things that can fail, all wired to a probe that restarts the pod. Each addition increases the chance of a fleet-wide crash loop.
"Alert on per-instance error rate instead." Genuinely useful and we added it — and it is detection, not mitigation. An alert pages a human; a readiness probe removes the instance in five seconds.
"Increase the liveness grace period." Reduces crash-looping and slows genuine recovery from a hung process. It papers over the fact that one endpoint is answering two questions.
The actual mechanism
Two different questions, with opposite correct responses:
Liveness: "is this process broken beyond recovery?" If yes → restart it. Should check only things a restart fixes: a deadlock, a wedged event loop, an unrecoverable internal state. It must not depend on anything external, because restarting does not fix an external problem — it only removes capacity during an incident.
Readiness: "can this instance serve traffic right now?" If no → remove it from rotation, leave it running. Should check everything required to serve a request, including external dependencies. Recovery is automatic when the dependency returns.
                 checks             on failure        during a dependency outage
liveness    internal state only     restart the pod   must NOT fail
readiness   dependencies too        drain traffic     SHOULD fail
The asymmetry in those two responses is what makes conflating them dangerous rather than merely imprecise. Point a liveness probe at a database and a database outage becomes a rolling restart of every healthy instance — each one killed for a condition no restart can fix, during the exact window you most need them running. The probe converts a dependency outage into a total outage, and does it fastest when the problem is most widespread.
The reverse conflation is quieter and costs just as much: a readiness probe that checks nothing external stays green while the instance cannot serve a single request.
Our first version had readiness checking nothing, so a broken instance kept traffic. Our second had liveness checking the database, so a shared blip killed the fleet. The bug both times was one endpoint for two questions.

A health check that cannot fail cannot protect you, and a health check wired to the wrong probe turns a dependency blip into a fleet restart. The question is not "is this healthy" but "what should happen if this fails".
The fix
Two endpoints, two probes, and a startup probe so cold starts are not mistaken for hangs.
/** LIVENESS — internal state only. A restart must be able to fix whatever this reports. */
@Get("/internal/live")
fun live(): HttpResponse {
    // the event loop is responsive: this handler running is most of the proof
    if (deadlockDetector.isStuck()) return HttpResponse.serverError("deadlock")
    if (shutdownInitiated) return HttpResponse.serverError("shutting down")
    return HttpResponse.ok()
}

/** READINESS — everything needed to serve a request. Fails during a dependency outage, by design. */
@Get("/internal/ready")
suspend fun ready(): HttpResponse {
    val checks = buildMap {
        put("db_pool", withTimeout(500.milliseconds) {
            runCatching { db.query("SELECT 1") }.isSuccess &&
                db.pool.available() > 0                      // ← the leak this missed
        })
        put("cache",  withTimeout(300.milliseconds) { runCatching { redis.ping() }.isSuccess })
        put("migrations_applied", migrator.isUpToDate())
        // NOT included: the recommendation service. We degrade without it.
    }
    return if (checks.values.all { it }) HttpResponse.ok(checks)
           else HttpResponse.status(503, checks)              // body names WHICH check failed
}
# each probe points at the endpoint that answers its question
startupProbe:   { httpGet: { path: /internal/live,  port: 8080 },
                  failureThreshold: 30, periodSeconds: 2 }     # 60s for a cold start
livenessProbe:  { httpGet: { path: /internal/live,  port: 8080 },
                  periodSeconds: 10, failureThreshold: 3 }
readinessProbe: { httpGet: { path: /internal/ready, port: 8080 },
                  periodSeconds: 5,  failureThreshold: 2 }
Five decisions:
db.pool.available() > 0 is the check that would have caught the original incident. A
SELECT 1 can succeed on a pool with one free connection while every request queues. Checking the
pool's capacity, not just its reachability, is the difference.
Every readiness check has a timeout. A check that hangs makes the probe hang, which times out and is treated as a failure — correct, and slow. An explicit 500ms bound makes the failure fast and intentional.
The response body names the failing check. {"db_pool": false, "cache": true} turns the first
step of triage into reading a line, instead of reasoning from a 503.
The recommendation service is deliberately excluded, with a comment saying why. Readiness should list only what you cannot work without; including a degradable dependency means an optional service can drain your fleet.
And a startupProbe so a 35-second cold start is not read as a hang — which is what caused the
crash-loop half of the second incident.
Plus per-instance alerting, as detection behind the automated mitigation:
- alert: SingleInstanceErrorRate
  expr: |
    sum by (instance) (rate(http_requests_total{status=~"5.."}[2m]))
      / sum by (instance) (rate(http_requests_total[2m])) > 0.1
  for: 2m
How we proved it
That the original incident now drains in seconds, reproduced by exhausting one instance's pool:
pool exhausted on instance-7
  before:  /health 200, in rotation, 26 min of 33% fleet errors (manual drain)
  after:   /internal/ready 503 at t+4s, removed from rotation at t+9s
           fleet error rate peak: 2.1% for 9 seconds
Twenty-six minutes to nine seconds, automatically.
That a dependency blip no longer restarts anything — the second incident, replayed:
database unreachable for 40s
  before (db in liveness):   3/3 instances killed, 3 restart cycles, 7 min outage
  after:                     3/3 fail readiness → all drained; 0 restarts
                             traffic resumes 6s after the db recovers
Note what "all drained" means here: with every instance unready, the service is down for those 40 seconds. That is correct — it genuinely cannot serve — and the crucial difference is that recovery is automatic and takes six seconds instead of seven minutes.
That the liveness probe still catches a real hang, because a check that never fails is where we started:
inject a deadlock in the request handler thread pool
  /internal/live → 503 after 1 iteration
  pod restarted at t+32s, recovered at t+67s
And a drill, run quarterly, since this is the class of thing that rots:
chaos drill: exhaust one instance's pool, measure time-to-drain
  Q3:  9s    Q4: 11s    (threshold: <30s)
One limit: readiness checks cost a request per instance every 5 seconds against the database and cache. Ours is a trivial query and a ping, measured at 0.4% of total database load for a three-instance fleet — worth knowing, and worth caching the result for a second or two on a larger fleet, which we have not needed.
What this generalizes to
A check that cannot fail is not a check. If no condition makes it return non-OK, it is a liveness signal for the HTTP server and nothing more. The first question about any health check is what would make it fail.
Ask what should happen on failure, and let that pick the mechanism. Restart, drain, alert, degrade, fail the request. Each is a different response, and wiring a condition to the wrong one is how a small problem becomes a fleet-wide one.
Never let an external dependency decide whether to restart your process. Restarting does not fix someone else's outage; it removes your capacity during it, and the cold starts make recovery slower. This is the single most common health-check mistake, and it is the dangerous direction.
An aggregate metric hides a single bad instance. A 33% fleet error rate reads as a shared dependency failure. Per-instance breakdowns are what make "one of them is broken" visible — and the readiness probe is what makes it unnecessary to notice.
Related
- The dashboard nobody looked at, and the alert that fired every day — alerting on symptoms
- The lock held across a network call, and the deadlock that followed — a pool exhaustion with a different cause
- 163 checks reported green. None of them read the published page. — checks that cannot fail
Keep reading
This is part of 100 practices of senior engineers — the habits that separate five years of experience from one year five times. Follow MobileByteSensei for the rest.
One post a week, no digest
New writing when it lands. No roundups, no course pitch, no "10 tips".