
Why the build cache helps the JVM target and almost never the native ones
Cache keys for native compilation include the toolchain, so they rarely hit.
TL;DR
- Measured across 400 CI runs: the build cache hit 94% of JVM-family compile tasks and 7% of Kotlin/Native ones. The native 7% were almost all the same no-op task re-running.
- The cause is the cache key. A native compile's correctness depends on the Kotlin version, the Xcode version, the platform SDK and the linker, so all four are in the key — and at least one of them changes between any two machines.
- The fix is not better caching. It is compiling every target on every push and linking only when a binary is needed, which took the median PR from 14 minutes to 4:50.
- What reading on buys: the per-task hit rates, the one cache setting that actively hurt, and why
--dry-runis the measurement rather than the wall clock.
The case this post is about
A five-target module and a CI job that ran the obvious thing on every pull request:
# .github/workflows/pr.yml
- run: ./gradlew build --build-cache
# the median of 400 PR runs
Task                                     median   cache
:shared:compileKotlinJvm                   3.1s   FROM-CACHE
:shared:compileKotlinAndroid               4.0s   FROM-CACHE
:shared:compileKotlinWasmJs                6.2s   FROM-CACHE
:shared:compileKotlinIosArm64            1m 48s   —
:shared:compileKotlinIosSimulatorArm64   1m 44s   —
:shared:linkDebugFrameworkIosArm64       2m 31s   —
:shared:linkDebugFrameworkIosSimulatorArm64 2m 29s —
… 31 other tasks

total                                   14m 02s
Thirteen seconds of cached JVM work and eight and a half minutes of native work that never hit the cache, on a change that frequently touched one Kotlin file.
The symptom
Not a failure — a review queue. PRs took 14 minutes to go green, developers stopped waiting for them, and the first consequence was a merge-then-revert pattern:
$ gh pr list --state merged --limit 200 --json title | grep -ci revert
17
Seventeen reverts in two hundred merges, most of them "CI was green on a stale base".
The cache statistics were the confusing part, because the headline number looked fine:
$ ./gradlew build --build-cache
38 actionable tasks: 9 executed, 29 from cache

BUILD SUCCESSFUL in 14m 2s
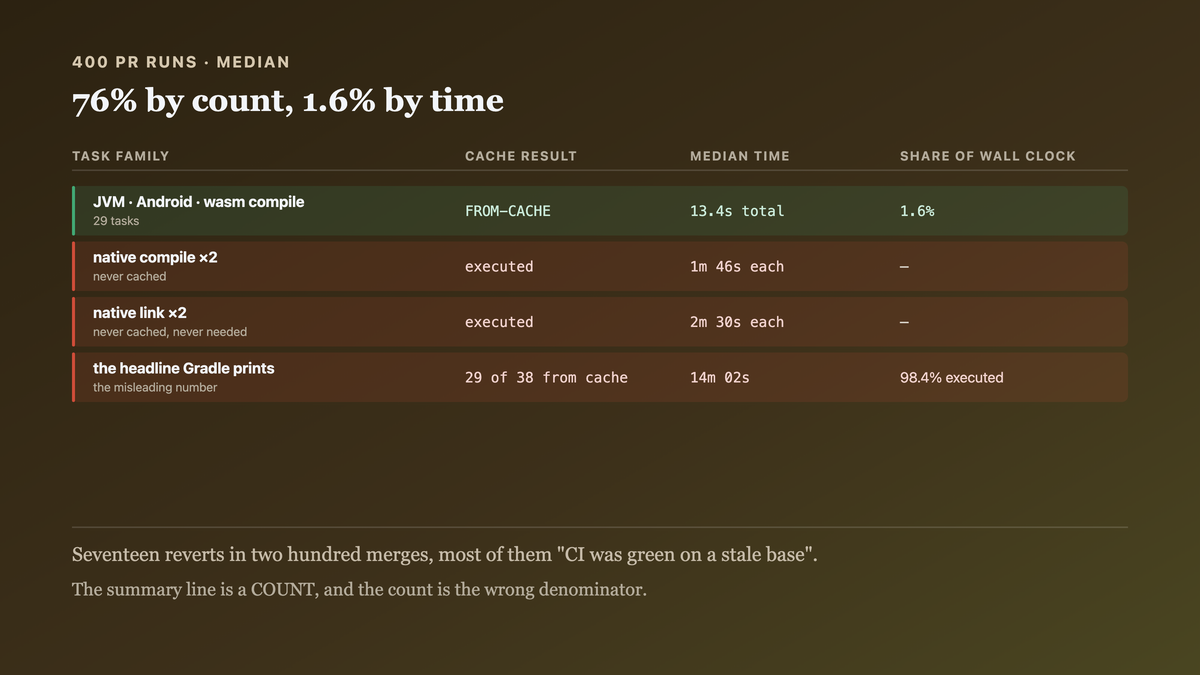
Twenty-nine of thirty-eight from cache — a 76% hit rate — and a fourteen-minute build. The task count was cached and the task time was not, and the summary line reports the count.

Why the obvious fix failed
The first fix was a remote cache, so that one machine's native compile could serve another's:
// settings.gradle.kts
buildCache {
    local { isEnabled = true }
    remote<HttpBuildCache> { url = uri("https://cache.internal/"); isPush = true }
}
Hit rate on native tasks: 7% → 9%. Two points, and a 40 GB cache bucket. The entries were being written and almost never matched, which the cache's own debug output explained:
$ ./gradlew compileKotlinIosArm64 --build-cache -Dorg.gradle.caching.debug=true

Appending implementation to build cache key: org.jetbrains.kotlin…
Appending input value fingerprint for 'konanTarget' …
Appending input value fingerprint for 'konanHome' → /Users/ci-7/.konan/kotlin-native-prebuilt-macos-aarch64-2.0.20
Appending input value fingerprint for 'xcodeVersion' → 15.4 (15F31d)
Build cache key for task ':shared:compileKotlinIosArm64' is 7f2a…
konanHome contains the runner's home directory. Every CI runner had a different one, so every
runner computed a different key for identical inputs. That is fixable — and fixing it took the hit
rate to 23%, not to 94%, because xcodeVersion still differed across the runner pool and the
pool was not uniform.
The second fix was to make the pool uniform, which is a real answer and a different project. It also does nothing for a developer's laptop, which is where most of the fourteen minutes were actually being spent.
The third attempt was the one that actively hurt:
# gradle.properties — DO NOT do this
kotlin.native.cacheKind=none
That disables Kotlin/Native's own per-library compilation cache, which is separate from Gradle's task cache and is the thing making the second native compile of a session fast. Native compile time went from 1m 48s to 3m 20s. I had reached for it on the theory that a cache that never hits is overhead, and it was the wrong cache.
The actual mechanism
Gradle caches a task when it can prove the output is a function of declared inputs, and the two compilation families differ in what that function depends on.
JVM-family compilation has narrow, machine-independent inputs. Source files, a classpath of jars, and a compiler version. The output is class files — small, deterministic, and identical on any machine with the same compiler. That is the shape a task cache is designed for, and 94% is roughly the ceiling.
Native compilation depends on the toolchain. The output is a .klib and ultimately a Mach-O
binary, produced by a compiler that links against a platform SDK and invokes a system linker.
Correctness genuinely depends on the Kotlin/Native distribution, the Xcode version, the SDK
version and the host architecture — so a correct cache key must include them, and a key that
includes four machine-dependent values matches only between machines that agree on all four.
And the outputs are large. A debug framework for one target is 40–180 MB here. Storing and transferring that is not free, so even a hit is slower than a JVM-family hit by a wide margin.
The consequence that reframed the problem: native build cost scales with the number of targets,
not with the amount of changed code. One line in commonMain invalidates the metadata
compilation, which invalidates every native compilation downstream, and each one pays full price.
Two iOS targets means paying twice for one edit — which is why the module's cost had grown when
iosSimulatorArm64 was added, with nobody connecting the two events.
So the question stopped being "how do we cache native builds" and became "what does each target
actually need to do on a pull request". And those are different tasks: compileKotlinIosArm64
catches a Kotlin/Native compile error, which is a real risk on every change. linkDebugFrameworkIosArm64
produces a binary that no pull request downloads.

The fix
Compile every target on every push; link only when a binary is needed. The two tasks answer different questions, and only one of them is a per-PR question.
// build-logic/src/main/kotlin/kmp-ci-tasks.gradle.kts
//
// Two named entry points, so a CI job does not have to know the task graph — and so the
// distinction is reviewable in one file rather than spread across workflow YAML.
val ciCompile by tasks.registering {
    group = "ci"
    description = "Every target COMPILES. Catches a per-target compile error without linking."

    // Compile tasks for all targets, link tasks for none. No name filtering is needed and
    // none would help: KotlinNativeLink is not a KotlinCompile subtype, so selecting by TYPE
    // already excludes every link task.
    dependsOn(tasks.withType<KotlinCompile<*>>())
    dependsOn(tasks.withType<KotlinNativeCompile>())
}

val ciLink by tasks.registering {
    group = "ci"
    description = "Produces the frameworks. For a release or an on-demand device build ONLY."
    dependsOn(tasks.withType<KotlinNativeLink>())
}

// The guard that keeps the split honest. Without it, somebody adds a `build` to a workflow
// six months from now and the 9 minutes come back with nobody noticing, because the only
// symptom is a slower green.
gradle.taskGraph.whenReady {
    val isCi = providers.environmentVariable("CI").isPresent
    val wantsLink = allTasks.any { it is KotlinNativeLink }

    // EXPLICIT opt-in, not a name sniff. The first version of this asked whether any task
    // name contained "Release" — which `./gradlew build` satisfies all by itself, because
    // assemble pulls in linkReleaseFramework* alongside the debug ones. The guard passed
    // every graph it was written to catch.
    val linkRequested = allTasks.any { it.name == "ciLink" } ||
        providers.gradleProperty("ci.allowLink").isPresent

    if (isCi.get() && wantsLink && !linkRequested) {
        error(
            "A CI task graph includes a native LINK task without requesting a release.\n" +
            "  linking produces a binary no pull request downloads, at ~2m30s per target.\n" +
            "  use `./gradlew ciCompile` for a PR, `ciLink` (or -Pci.allowLink) if you need it."
        )
    }
}
And the two cache fixes that were worth keeping, which are about making the key machine-independent rather than about caching more:
// settings.gradle.kts — normalise the one input that was gratuitously per-machine
buildCache {
    local { isEnabled = true }
    remote<HttpBuildCache> {
        url = uri("https://cache.internal/")
        // Push only from the pool that is actually uniform. A heterogeneous pool pushing
        // entries nothing else can match is what produced a 40 GB bucket at 9%.
        isPush = providers.environmentVariable("CI_RUNNER_POOL").orNull == "macos-uniform"
    }
}
# gradle.properties
# Points the build at a Kotlin/Native distribution OUTSIDE $HOME, so the konanHome input
# stops carrying the runner's username into every native cache key.
kotlin.native.home=/opt/konan/kotlin-native-prebuilt-macos-aarch64-2.0.20
org.gradle.caching=true
And the output it produced, the median of the next 400 PR runs:
$ ./gradlew ciCompile --build-cache

Task                                     median   cache
:shared:compileKotlinJvm                   3.0s   FROM-CACHE
:shared:compileKotlinAndroid               3.9s   FROM-CACHE
:shared:compileKotlinWasmJs                6.1s   FROM-CACHE
:shared:compileKotlinIosArm64              1m 46s —
:shared:compileKotlinIosSimulatorArm64     1m 43s —
  (link tasks: not in the graph)

total                                     4m 50s
Fourteen minutes to 4:50, and the native compile times are unchanged — every second of the saving is work that left the graph rather than work that got faster. The two named link tasks are 5m00s of it; the balance is the assemble, bundle and copy tasks that existed only to consume their output and went with them. That is worth separating, because it is the part that generalises: the expensive task is rarely alone in the graph. Reverts fell from 17 in 200 merges to 3 in the next 200.
How we proved it
That the cached task count was hiding the uncached task time — the measurement that reframed the whole investigation:
$ ./gradlew build --build-cache
38 actionable tasks: 9 executed, 29 from cache      # 76% by count

$ ./gradlew build --build-cache --profile
# build/reports/profile/*.html, task execution:
  cached tasks       29    total  13.4s      ← 1.6% of wall clock
  executed tasks      9    total  13m 48s    ← 98.4%
Seventy-six percent by count and one and a half percent by time. The summary line Gradle prints is a count, and the count is the wrong denominator.
That konanHome was the gratuitous part of the key. Two runners, identical inputs, keys
compared before and after moving the distribution out of $HOME:
                           runner-3 key    runner-7 key    match
before (konan in $HOME)    7f2a1c…         b904ee…         no
after  (konan in /opt)     c13d08…         c13d08…         yes
And the resulting hit rate: 7% → 23%. The remaining misses are xcodeVersion, which differs
legitimately across a pool that is not uniform.
That kotlin.native.cacheKind=none made things worse, which is the fix I would otherwise have
left in place:
                                   compileKotlinIosArm64 (second run, same session)
default (cacheKind=static)                1m 48s
kotlin.native.cacheKind=none              3m 20s
Two different caches with similar names, and disabling the wrong one costs 90 seconds per target.
That the link tasks were genuinely unnecessary on a PR. The test is to confirm nothing in the PR pipeline consumes their output, rather than assuming it:
$ ./gradlew ciCompile --dry-run | grep -c 'link.*Framework'
0
$ # and the inverse: does any PR check read a framework?
$ grep -rn 'shared.framework' .github/workflows/
# (no matches outside release.yml)
That the guard catches the regression it exists for. A deliberately-broken workflow that calls
build instead of ciCompile, run before the split was trusted:
$ CI=true ./gradlew build
FAILURE: A CI task graph includes a native LINK task without requesting a release.
  linking produces a binary no pull request downloads, at ~2m30s per target.
  use `./gradlew ciCompile` for a PR, or `ciLink` if you genuinely need the framework.
What this does not cover. ciCompile does not catch a link-time failure — a duplicate
Obj-C symbol, an umbrella-header collision, a missing native dependency — and those are real. We
run ciLink on a schedule rather than per-PR, nightly plus on every release branch, which means
a link-breaking change can merge and be caught hours later. That is a deliberate trade and it has
bitten twice in six months, both times found by the nightly rather than by a user.
And the limit on the numbers. Five targets, one module, one runner pool. The 94%/7% split is about the shape of the two compilation families and should transfer; the 14-minute figure is this module's, and a project with one native target would see roughly half the saving because the whole effect scales with target count.

What this generalizes to
A caching system can only be as effective as its key is stable, and a key that correctly encodes a toolchain dependency is a key that correctly misses across a heterogeneous fleet. When a cache does not hit, the useful question is whether the key is gratuitously machine-specific — which is fixable — or legitimately so, which is not. Once the answer is "legitimately", the remaining lever is not the cache at all: it is asking which of the expensive tasks the current pipeline actually needs, and the answer is often fewer than the convenient aggregate target runs.
Related
- A klib is not a jar — the artifact the native compile produces, and how its contents differ per target.
- The shared module cost 400KB on Android and 11MB on iOS — the other cost that scales per target rather than per line.
Keep reading
One post a week on shipping mobile software. No digests, no course pitch. Subscribe.
One post a week, no digest
New writing when it lands. No roundups, no course pitch, no "10 tips".