
Gradle's configuration cache, and the one task that kept invalidating it
A task capturing Project at execution time disables it for the whole build.
TL;DR
- Our Gradle configuration time was 48 seconds on every build, including no-op ones, because a
custom task in
build-logiccapturedProjectat execution time — which disables the configuration cache for the entire build, not just that task. There turned out to be two. - The log said so, once, in a line among 200.
--configuration-cache-problems=warnwas set, which is what turned a hard failure into a line nobody read. - Fixing them took configuration to 0.9 s on a cache hit. The fix is at source and template-derived, so it went upstream rather than staying local.
- What reading on buys: the report that names the offending task, why it is all-or-nothing, and the
two patterns that capture
Projectwithout looking like they do.
The case this post is about
A task that stamps build metadata into a generated Kotlin file:
// build-logic/src/main/kotlin/GenerateBuildInfo.kt
abstract class GenerateBuildInfo : DefaultTask() {

    @get:OutputFile abstract val output: RegularFileProperty

    @TaskAction
    fun generate() {
        // `project` inside a task action. This is the whole problem, and it reads as ordinary
        // Gradle code because it was ordinary Gradle code for a decade.
        val version = project.version.toString()
        val name = project.name
        val sha = project.providers.exec { commandLine("git", "rev-parse", "--short", "HEAD") }
            .standardOutput.asText.get().trim()

        output.get().asFile.writeText(
            """
            package com.example.build
            object BuildInfo {
                const val VERSION = "$version"
                const val MODULE = "$name"
                const val COMMIT = "$sha"
            }
            """.trimIndent()
        )
    }
}
# gradle.properties
org.gradle.configuration-cache=true
org.gradle.configuration-cache.problems=warn
The symptom
Configuration time that never improved, on any build:
$ ./gradlew :shared:compileKotlinJvm
Calculating task graph as no cached configuration is available for tasks: …
BUILD SUCCESSFUL in 1m 14s
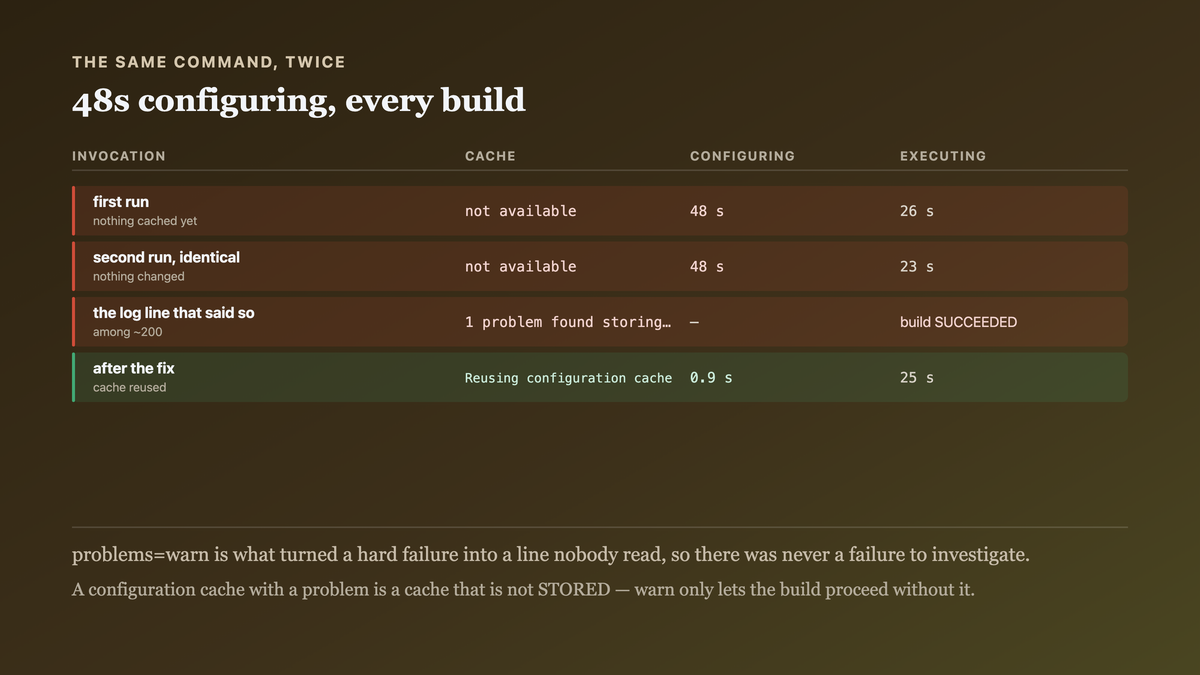
  48s configuring, 26s executing

$ ./gradlew :shared:compileKotlinJvm       # immediately again, nothing changed
Calculating task graph as no cached configuration is available for tasks: …
BUILD SUCCESSFUL in 1m 11s
  48s configuring, 23s executing
"No cached configuration is available" on the second identical invocation. The cache was enabled and never hit, so forty-eight seconds of configuration on every build — which on a KMP project with eleven modules and five targets is a large fraction of an incremental build.
And the reason, present in the log the whole time:
$ ./gradlew :shared:compileKotlinJvm 2>&1 | grep -A3 'configuration cache problem'
1 problem was found storing the configuration cache.
- Task `:shared:generateBuildInfo` of type `GenerateBuildInfo`: invocation of
  'Task.project' at execution time is unsupported.
  See https://docs.gradle.org/…/configuration_cache.html#config_cache:requirements:use_project_during_execution
One line, in a build that prints around two hundred. And because problems=warn was set, the build
succeeded — so there was never a failure to investigate.

Why the obvious fix failed
The first fix was to raise the problem threshold, which is what the warning invites:
org.gradle.configuration-cache.problems=warn
org.gradle.configuration-cache.max-problems=10
That is the setting that was already there. It does not make the cache work — it makes the build
proceed without it. A configuration cache with a problem is a configuration cache that is not
stored, and warn converts that from an error into a silent performance loss.
The second attempt was to disable the cache for the one task:
tasks.named("generateBuildInfo") { notCompatibleWithConfigurationCache("uses project") }
Which is the sanctioned annotation and does something narrower than it sounds: it marks the task so that running it disables the cache for that invocation. Any build whose graph includes it — which is every build, because the generated file is a compile input — still gets no cache. It silences the warning and keeps the cost.
The third attempt was to assume the cache was not worth it on a KMP project:
org.gradle.configuration-cache=false
Honest and wrong. The measurement below is the reason: 48 s to 0.9 s is not a marginal gain, and the only thing standing in the way was one task.
The actual mechanism
The configuration cache stores the task graph, and storing it requires that every task's state be serialisable and independent of the live build model.
Task.project is the live build model. It is a mutable object graph with references to the
Gradle instance, every other project, the file system and the configuration containers. It cannot
be serialised, and a task that reaches for it at execution time cannot have its state captured.
And the cache is all-or-nothing per invocation. Gradle does not store a partial graph. One
unserialisable task means the whole graph is not stored, so every other task's configuration is
recomputed too — which is why one task in build-logic cost 48 seconds across eleven modules.
The two patterns that capture Project without looking like it are the ones that cost the most
time to find:
// 1. a lambda that closes over `project`, passed to something that runs later
doLast { logger.lifecycle("built ${project.version}") }      // `project` captured

// 2. a property whose DEFAULT is computed from project at execution time
@get:Input val version: Property<String> = project.objects.property<String>()
    .convention(provider { project.version.toString() })     // the provider captures it
The second is the one we also had, in a different task, and it is invisible: the convention looks
like configuration-time code and the provider { } defers it to execution.
The fix is to capture the VALUES at configuration time and hand them to the task as inputs. Which is also better Gradle: the task's inputs become explicit, so it is correctly up-to-date-checked and cacheable in the ordinary task-output sense as well.

The fix
Inputs as properties, resolved at configuration time, and nothing reaching for project inside the
action.
// build-logic/src/main/kotlin/GenerateBuildInfo.kt
//
// No `project` in the task action, and nothing deferred that closes over it. Every input is a
// Property set at configuration time, which is both what the configuration cache requires and
// what makes the task correctly up-to-date-checked.
@CacheableTask
abstract class GenerateBuildInfo : DefaultTask() {

    @get:Input abstract val version: Property<String>
    @get:Input abstract val moduleName: Property<String>

    /**
     * An ordinary input property. What matters is what gets WIRED into it below — a
     * ValueSource, because the git SHA genuinely changes between builds and must be re-read,
     * and a ValueSource is the mechanism that lets one input be re-evaluated without
     * invalidating the stored graph. A `provider { exec(...) }` at the wiring site would
     * instead run git during configuration on every build, trading the cache miss for a
     * process spawn.
     */
    @get:Input abstract val commitSha: Property<String>

    @get:OutputFile abstract val output: RegularFileProperty

    @TaskAction
    fun generate() {
        output.get().asFile.writeText(
            """
            package com.example.build
            object BuildInfo {
                const val VERSION = "${version.get()}"
                const val MODULE = "${moduleName.get()}"
                const val COMMIT = "${commitSha.get()}"
            }
            """.trimIndent()
        )
    }
}

/** The git read, as a ValueSource so it is re-evaluated without invalidating the task graph. */
abstract class GitShaSource : ValueSource<String, ValueSourceParameters.None> {
    @get:Inject abstract val execOps: ExecOperations

    override fun obtain(): String = ByteArrayOutputStream().also { out ->
        execOps.exec {
            commandLine("git", "rev-parse", "--short", "HEAD")
            standardOutput = out
            // A repo with no commits, or no git, must not fail the BUILD — it must produce a
            // recognisable placeholder. A build that cannot run outside a git checkout is a
            // build that fails in a release tarball.
            isIgnoreExitValue = true
        }
    }.toString().trim().ifEmpty { "unknown" }
}
// build-logic/src/main/kotlin/kmp-library.gradle.kts — wired at CONFIGURATION time
val buildInfo = tasks.register<GenerateBuildInfo>("generateBuildInfo") {
    // project.version and project.name are read HERE, during configuration, where reaching
    // for the project model is correct and supported.
    version.set(project.version.toString())
    moduleName.set(project.name)
    commitSha.set(providers.of(GitShaSource::class) {})
    output.set(layout.buildDirectory.file("generated/buildinfo/BuildInfo.kt"))
}

kotlin.sourceSets.commonMain { kotlin.srcDir(buildInfo.map { it.output.get().asFile.parentFile }) }
And the setting change, which is the part that stops this recurring:
# gradle.properties
org.gradle.configuration-cache=true
# FAIL, not warn. `warn` is what turned a hard error into one line in a 200-line log and cost
# 48 seconds per build for an unknown number of months. A configuration-cache problem is a
# performance regression that produces no failing build, so the build has to fail.
org.gradle.configuration-cache.problems=fail
And the output it produced:
$ ./gradlew :shared:compileKotlinJvm        # first run, stores the cache
Calculating task graph as no cached configuration is available
BUILD SUCCESSFUL in 1m 09s
  44s configuring, 25s executing

$ ./gradlew :shared:compileKotlinJvm        # second run
Reusing configuration cache.
BUILD SUCCESSFUL in 26s
  0.9s configuring, 25s executing
Forty-eight seconds to 0.9 on a hit. And because build-logic is template-derived, the fix went
upstream as a draft PR rather than staying in this project.
How we proved it
That one task disabled it for the whole build — the measurement that made the scale clear, because "one task is not cached" sounds local:
  tasks in the graph                                   412
  tasks reported as a configuration-cache problem        1
  tasks whose configuration was recomputed             412
  configuration time                                  48 s
All-or-nothing, which is why the ratio of cause to cost is so lopsided.
That notCompatibleWithConfigurationCache silences rather than fixes. Both measured, since it is
the sanctioned-looking escape:
                                              warning   cache stored   configuring
  as found                                      yes         no            48 s
  + notCompatibleWithConfigurationCache          no         no            47 s
  + the task fixed                               no        yes            0.9 s
The middle row is the dangerous one: the warning is gone and the cost is unchanged, so the problem is now invisible and unfixed.
That the second offending pattern existed and was invisible. Found by setting problems=fail
rather than by reading code:
$ ./gradlew build                          # with problems=fail
2 problems were found storing the configuration cache.
- Task `:shared:generateBuildInfo`: invocation of 'Task.project' at execution time
- Task `:shared:printVersion`: invocation of 'Task.project' at execution time
      (a doLast lambda closing over `project`)
Two, not one — and the reason the first investigation found one is duller and more useful than a
reporting limit. Gradle reports problems for the tasks in THIS invocation's graph, and
:shared:printVersion is not in the graph of :shared:compileKotlinJvm. Every count in a
configuration-cache report is scoped to what you asked for, so "1 problem" was never a statement
about the project. Running it against build is what made the graph wide enough to tell.
That the ValueSource re-reads without invalidating the graph. The property that makes the git SHA workable, verified by changing commits between builds:
  build 1, commit abc1234    cache stored,   BuildInfo.COMMIT = abc1234
  build 2, same commit       cache REUSED,   0.9s configuring
  build 3, commit def5678    cache REUSED,   1.1s configuring, BuildInfo.COMMIT = def5678
The graph is reused and the one input is re-evaluated. A provider { exec(…) } would instead run
git during configuration on every build, which is 180 ms and a process spawn.
That the no-git case does not fail the build. The fixture, because a release tarball has no
.git:
$ (cd /tmp/no-git-copy && ./gradlew :shared:compileKotlinJvm)
BuildInfo.COMMIT = "unknown"
BUILD SUCCESSFUL
Without isIgnoreExitValue, that is a build failure in exactly the environment least able to
diagnose it.
What I cannot tell you is the full list of configuration-cache incompatibilities in our plugins.
We fixed our own two and problems=fail currently passes — which means every third-party plugin in
the graph is also compatible at the versions we use, and a plugin upgrade can reintroduce a problem
we will then meet as a build failure. That is the correct failure mode and it will be somebody's
surprise.
And an honest cost of problems=fail. It makes a plugin upgrade able to break the build for a
performance reason, which is a real tradeoff and one I would argue for: the alternative cost us 48
seconds per build for months with nobody noticing.

What this generalizes to
A setting that downgrades an error to a warning converts a problem you would have fixed into one you will never see, and the ones worth watching for are those whose only symptom is slowness — there is no failing test for a build that is merely slow. The second lesson is about blast radius: when a mechanism is all-or-nothing, a single non-conforming component carries the whole cost, so the instinct to treat one warning as a local matter is wrong by exactly the size of the graph.
Related
- Why the build cache helps the JVM target and almost never the native ones — the other Gradle cache, and why its misses are legitimate rather than fixable.
- A klib is not a jar — the other build-level surprise that reports a symptom one layer from its cause.
Keep reading
One post a week on shipping mobile software. No digests, no course pitch. Subscribe.
One post a week, no digest
New writing when it lands. No roundups, no course pitch, no "10 tips".