
The latency maths that decides on-device versus an API call
Comparing a local model to an API is not a race between two averages — it is tail latency, failure rates, and how often one task crosses the boundary.
The comparison usually gets made as two numbers: the model takes this long locally, the API takes that long over the network. Pick the smaller one.
Both numbers are averages, and averages are the one summary that hides every property that actually decides this.
The case this post is about
One task, measured at one network crossing and at five:
1x local  { typicalMs: 1840, badCaseMs: 1840, pSlowPath: 5,    pNeverReturns: 0 }
1x remote { typicalMs: 180,  badCaseMs: 4340, pSlowPath: 5,    pNeverReturns: 1.4 }
5x local  { typicalMs: 2680, badCaseMs: 3200, pSlowPath: 22.6, pNeverReturns: 0 }
5x remote { typicalMs: 900,  badCaseMs: 8481, pSlowPath: 22.6, pNeverReturns: 6.8 }
The typical column favours remote at both widths, and it is the only column anybody quotes — 180ms against a 1,840ms cold start.
Going from one crossing to five costs local 1,360ms of bad case and remote 4,141ms, because warmth amortises and a tail does not. At five crossings there is a 6.8 per cent chance one of them never comes back, against zero locally.
This post follows those four rows, because the comparison that gets run is the first column.
The symptom
The decision gets made early, from a benchmark and a latency figure, and then it is structural — a local model shapes your binary size, your minimum device spec and your threading; an API shapes your backend, your cost model and your privacy story. Reversing it later is not a refactor.
What makes the early decision unreliable is that the two options fail in completely different ways:
- the local model is slow on old hardware and consistent on any given device
- the API is fast on good connectivity and unbounded on bad
- the local model does not fail; it just takes its time
- the API fails, and the failure arrives after a timeout you chose
An average flattens all four of those into one figure that describes neither option's behaviour at the moment a user is actually waiting.

Why the obvious fix failed
The obvious fix is to measure both properly: run the local model on a real device, call the API over a real network, compare.
That is a genuine improvement and still answers the wrong question, because it is almost always run on one device and one network — usually a recent phone on office wifi, which is the most favourable conditions either option will ever see, and favourable in a way that flatters the API far more than the local model.
The second attempt is to add a percentile. Better, and the p95 you measure on good wifi is not the p95 your users have. Tail latency on a mobile network is dominated by conditions you cannot reproduce at a desk: congested cells, handovers, captive portals, a train entering a tunnel.
The actual mechanism
Compare distributions under the conditions each option actually meets, and account for the calls that never complete.
The four quantities that decide it:
The tail, not the mean. p95 and p99 are what users remember, because those are the waits long enough to notice. A local model with a worse mean and a tighter distribution can beat an API with a better mean and a long tail.
The failure rate, and what a failure costs. A network call has a probability of not completing. That is not a latency figure, it is a separate axis, and the cost of landing on it is a user who waited the full timeout and then got nothing. A local model's equivalent is far rarer and usually means something is badly wrong rather than that the user is on a train.
Cold start, counted at its real frequency. The local model's first call is much more expensive than the rest, and the process dies more often than anyone's mental model expects. An honest comparison includes that cost weighted by how often it actually happens, not amortised away.
The round trips per task. This is the one that most often reverses the answer and the one most often left out.
The fix
That last quantity deserves its own argument, because the per-call comparison can be decisively correct and still produce the wrong system.
A task that needs one inference is a straightforward per-call comparison. A task that needs five — an iterative refinement, a per-keystroke suggestion, a pass over a list of items — multiplies the network cost by five and the local cost by five, and those two multiplications are not equivalent. Five local calls are warm after the first. Five network calls are five independent opportunities to hit the tail, and their latencies compound rather than average.

So the question is not which is faster. It is how many times does this task cross the boundary, and the answer frequently settles it before latency is considered at all.
A good heuristic I would defend: if the interaction is per-keystroke, per-scroll or per-item, on-device is probably right regardless of the per-call numbers. If it happens once per user-initiated action and the quality difference is material, the API probably wins. The middle ground is where measurement is worth the effort.
The heuristic is a consequence of how the two distributions compose, which is worth computing because the per-call comparison and the per-task comparison can disagree:
type Dist = { p50: number; p95: number; p99: number; timeoutPct: number; timeoutMs: number };

const LOCAL: Dist  = { p50: 210, p95: 340,  p99: 1_840, timeoutPct: 0,    timeoutMs: 0 };
const REMOTE: Dist = { p50: 180, p95: 900,  p99: 4_200, timeoutPct: 1.4,  timeoutMs: 10_000 };

// Across N independent crossings, the chance of hitting the tail AT LEAST ONCE
// compounds. This is the step the per-call comparison cannot see.
function task(d: Dist, crossings: number, warmAfterFirst: boolean) {
  // Typical: local pays its initialisation ONCE and is warm after; remote pays
  // its median every single time, because nothing is retained between calls.
  const typical = warmAfterFirst
    ? d.p99 + (crossings - 1) * d.p50
    : crossings * d.p50;

  // Bad case, same shape for both: one call in its p99, the rest in their p95,
  // plus the expected cost of a crossing that never returns.
  const pTailOnce = 1 - Math.pow(1 - 0.05, crossings);
  const pTimeoutOnce = 1 - Math.pow(1 - d.timeoutPct / 100, crossings);
  const badCase = d.p99 + (crossings - 1) * d.p95 + d.timeoutMs * pTimeoutOnce;

  return { typicalMs: Math.round(typical), badCaseMs: Math.round(badCase),
           pSlowPath: Math.round(pTailOnce * 1000) / 10,
           pNeverReturns: Math.round(pTimeoutOnce * 1000) / 10 };
}
One crossing, then the same task at five:
console.log("1x local ", task(LOCAL, 1, true));
console.log("1x remote", task(REMOTE, 1, false));
console.log("5x local ", task(LOCAL, 5, true));
console.log("5x remote", task(REMOTE, 5, false));
1x local  { typicalMs: 1840, badCaseMs: 1840, pSlowPath: 5,    pNeverReturns: 0 }
1x remote { typicalMs: 180,  badCaseMs: 4340, pSlowPath: 5,    pNeverReturns: 1.4 }
5x local  { typicalMs: 2680, badCaseMs: 3200, pSlowPath: 22.6, pNeverReturns: 0 }
5x remote { typicalMs: 900,  badCaseMs: 8481, pSlowPath: 22.6, pNeverReturns: 6.8 }
The typical column favours remote at both widths, and it is the only column anybody quotes: 180ms against a 1,840ms cold start at one crossing, 900 against 2,680 at five. The bad case is where the two shapes separate. Going from one crossing to five costs local 1,360ms and remote 4,141ms — because warmth amortises and a tail does not — and at five crossings there is a 6.8% chance that one of them never comes back at all, against zero locally. That is the comparison the heuristic is a shorthand for: a per-keystroke feature is the five-crossing row many times a minute, and the column it is being chosen on is the one that barely moved.
How we proved it
The honest statement of evidence, because this article is arithmetic rather than measurement.
Not measured: I have not benchmarked Gemini Nano, ML Kit or Core ML against a hosted model on a device fleet. There are no latency numbers in this article and I am not going to invent any — the ratios depend on the model, the device class, the network and the task, and a figure from my desk would be worse than no figure because it would look authoritative.
What is measured is adjacent and structural: that the warm and cold paths of an expensive local
initialisation differ by orders of magnitude, and that derived summary numbers hide the thing you
needed to see. I have been caught by the second one directly — a tool reported moving: true about
an animation while 41 of its 43 frames were identical, because the claim was derived from file size
rather than from a count. The summary was true about its input and false about reality.
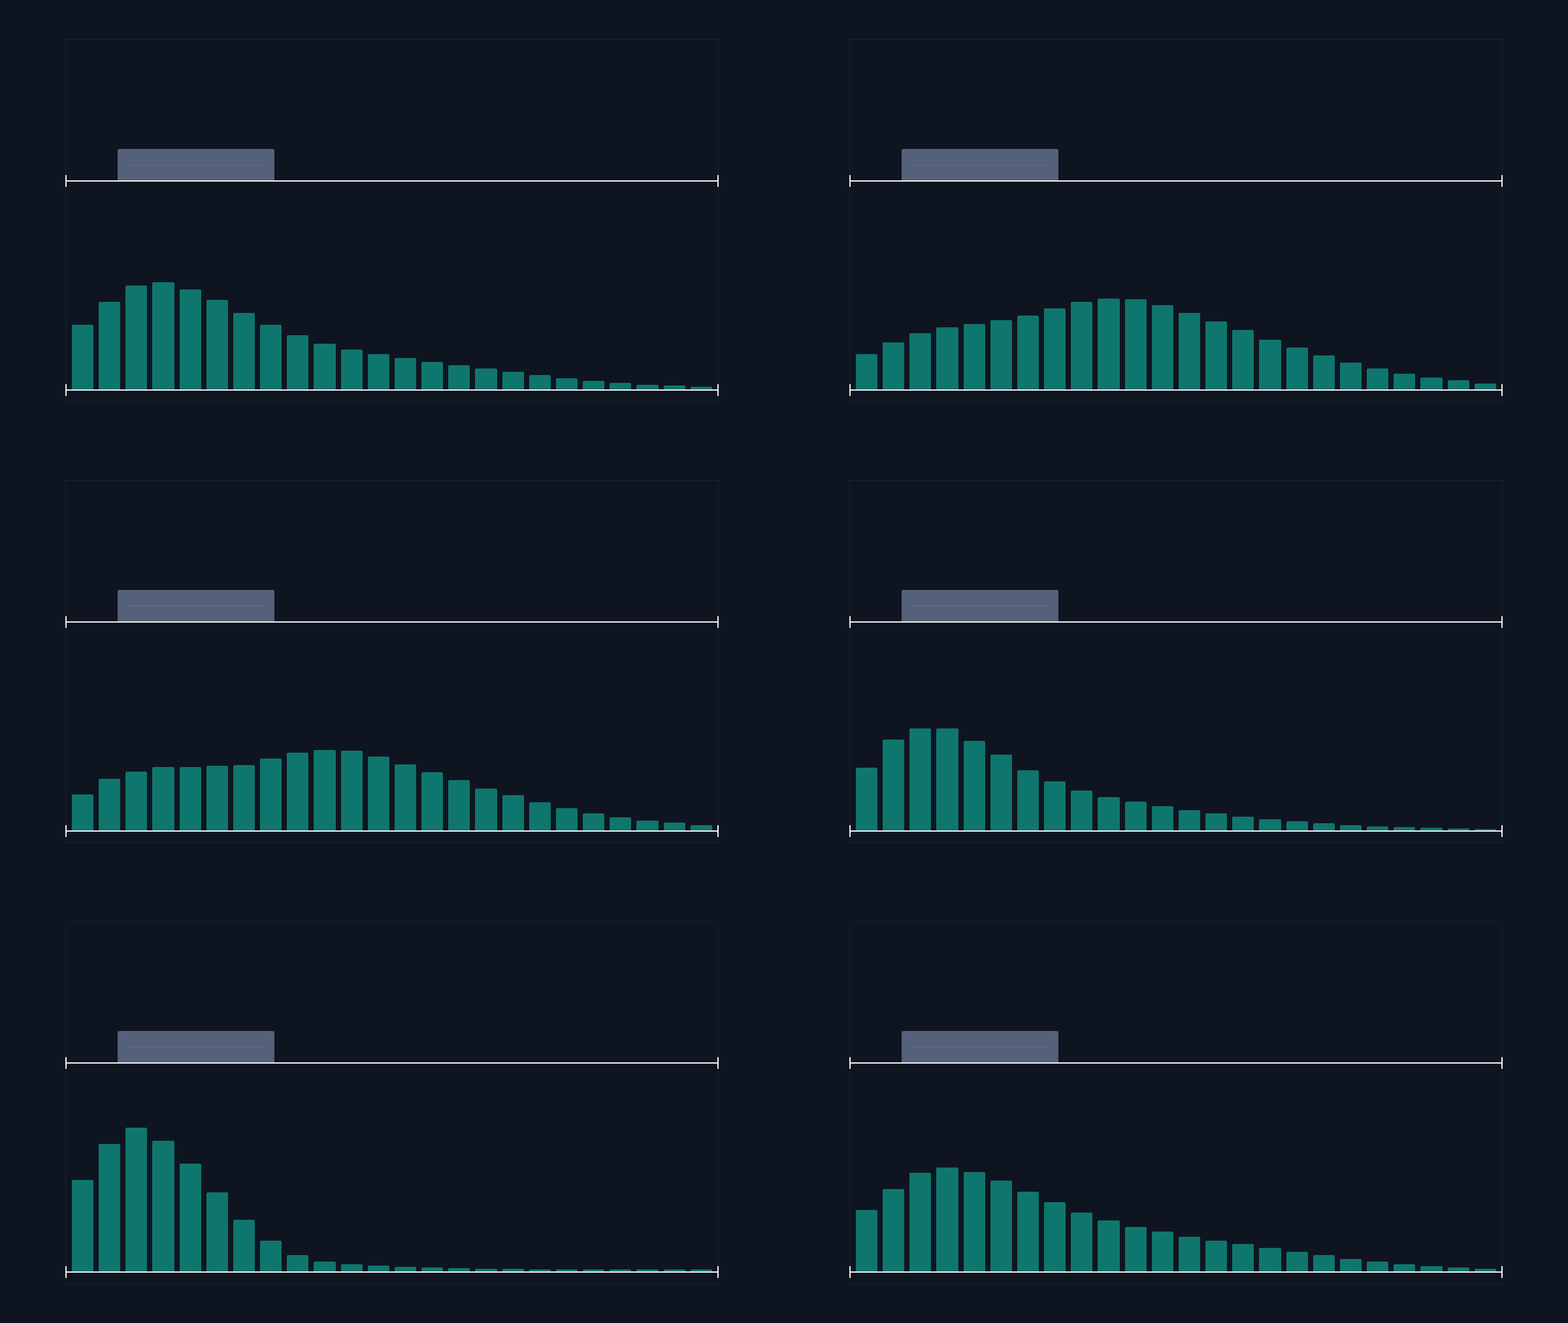
An average latency is exactly that shape of claim. It is correctly computed and it answers a question nobody asked, and the only defence is to look at what it was computed from.
The axes that are not latency
Worth stating plainly, because a pure speed comparison quietly assumes everything else is equal and it never is.
Capability. A small local model cannot do what a large hosted one can, and no amount of latency advantage fixes a wrong answer. If the task genuinely needs the bigger model, the comparison is over before it starts.
Cost shape. An API costs per call forever, scaling with usage. A local model costs binary size, device requirements and engineering time, paid once. Those are different kinds of expense and which one you prefer is a business question wearing an engineering costume.
What leaves the device. On-device keeps the input local, which is a genuine property and a narrower one than it sounds — I have written separately about how much still leaves through crash reports, analytics and backups.
Who is on the hook at 3am. An API has an operator, a status page and somebody paged. A local model has you, a rollout you may not be able to reverse quickly, and a bug report that says the feature got worse.
What this generalizes to
When choosing between a local expensive thing and a remote one, do not compare the two averages. Put the two distributions side by side under the conditions each will actually meet, add the failure rate as its own axis, and count how many times a single user task crosses the boundary.
Then check whether latency is deciding anything at all. Frequently the round-trip count settles it, or the capability gap does, or the question of what you are allowed to send. The latency comparison is the one everybody runs first because it is the easiest to produce — which is not the same as being the one that matters.
One post a week, no digest
New writing when it lands. No roundups, no course pitch, no "10 tips".