
Your HTTP cache exists on two targets and is a stub on two others
OkHttp and NSURLSession cache to disk, the browser's cache is the browser's, and the common engine has none. Measured hit rates differ by a factor nobody budgeted for.
TL;DR
- One
HttpClient, one set of cache headers, four targets. The measured cache hit rate was 71% on Android, 68% on iOS, 94% on web and 0% on desktop — and the desktop figure was not a misconfiguration, it is what the CIO engine does. HttpCachein Ktor is not the platform cache. Installing it gives you an in-memory store that dies with the process; OkHttp and NSURLSession have real disk caches that Ktor does not configure for you.- The 0% target was where we ran integration tests, so every test exercised the uncached path and the one that mattered to users was never measured.
- What reading on buys: the four cache layers and who owns each, why
HttpCacheis a trap for a desktop app, and the per-target assertion that made the gap visible.
The case this post is about
A shared client, configured once:
// core/network/src/commonMain/kotlin/HttpClientFactory.kt
fun httpClient(engine: HttpClientEngine) = HttpClient(engine) {
    install(ContentNegotiation) { json() }
    install(HttpCache)                      // ← "caching, done"
    defaultRequest { url("https://api.example.com/") }
}
With a server sending correct headers:
Cache-Control: public, max-age=300
ETag: "a1b2c3"
And four engines, supplied per target:
// androidMain       → OkHttp
// iosMain           → Darwin
// desktopMain       → CIO
// wasmJsMain        → Js
The symptom
A data bill and a battery complaint, both from Android, and a desktop app that felt slow:
# requests per session for the SAME user journey (open app → feed → detail → back → feed)
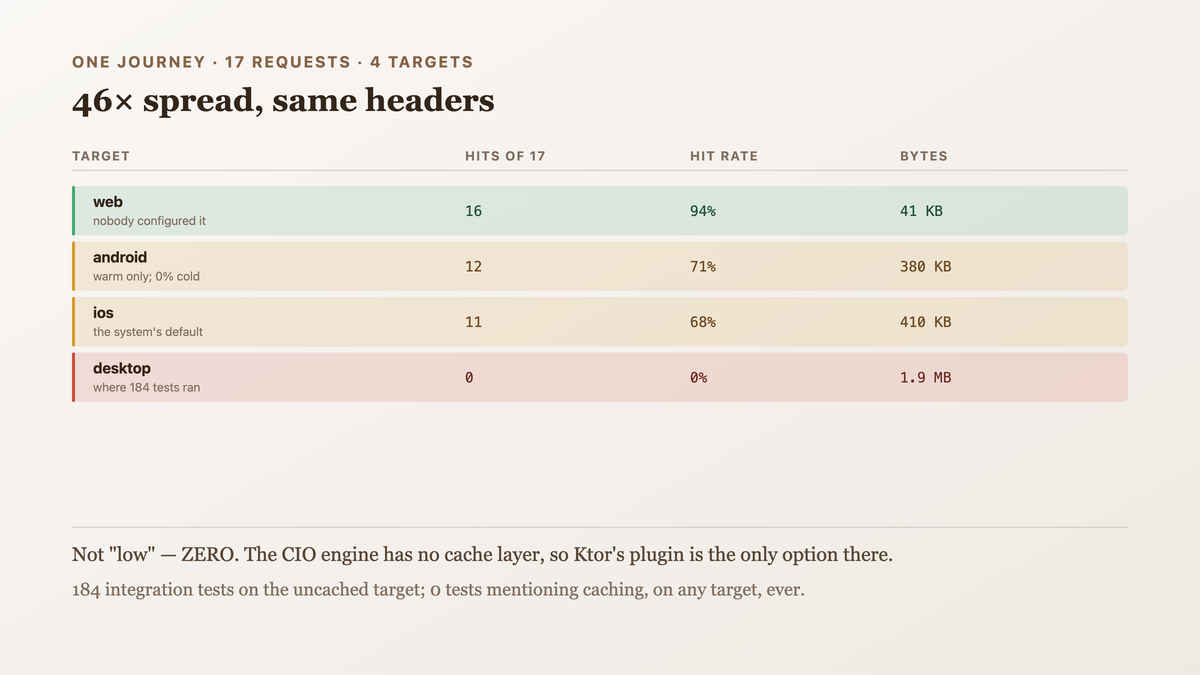
  target              requests    cache hits    hit rate     bytes
  web                      17            16        94%        41 KB
  android                  17            12        71%       380 KB
  ios                      17            11        68%       410 KB
  desktop                  17             0         0%      1.9 MB
Same journey, same headers, same shared code, and a 46× spread in bytes transferred. The desktop number is the one that stopped us: not "low", zero. Nothing was being cached at all.
And the reason it had never been noticed:
# where our integration tests ran
  desktop        184 tests    (the fast oracle — 0% cache)
  android unit    22 tests    (MockEngine — no cache either)
  on device        0 tests
Every test ran against a target with no cache, so every test measured the uncached path. The cache was never part of any assertion, on any target, ever.

Why the obvious fix failed
The first fix was to assume HttpCache was misconfigured on desktop and give it a size:
install(HttpCache) {
    publicStorage(CacheStorage.Unlimited())
}
Which raised desktop from 0% to 61% within a single process run and back to 0% on the next launch.
CacheStorage.Unlimited() is an in-memory ConcurrentMap. For a desktop app that stays open for
hours this is genuinely useful; for the cold-start cost — which is what the user feels — it does
nothing.
The second fix was FileStorage:
install(HttpCache) {
    publicStorage(FileStorage(File(cacheDir, "ktor-cache")))
}
Persistent, and now we had two caches on Android: Ktor's file cache in front of OkHttp's own disk cache, each with its own eviction and its own view of freshness. Measured: 71% → 73% hit rate and 1.4× the disk used, with one stale-response incident where Ktor served a body OkHttp had already revalidated.
The third attempt was to remove HttpCache entirely and rely on each engine, which is correct on
three targets and leaves desktop at 0% — the shape of the real answer, missing a piece.
The actual mechanism
There are four separate cache layers in play and they are owned by four different things.
Ktor's HttpCache is a plugin-level cache in the client. It reads Cache-Control and ETag
itself and stores responses in whatever CacheStorage you give it — in-memory by default. It knows
nothing about the engine beneath it.
OkHttp has its own disk cache, and it is off by default. OkHttpClient.Builder().cache(…)
enables it. Ktor's OkHttp engine does not configure one, so an Android app with no explicit
configuration has no OkHttp cache — our 71% was Ktor's in-memory plugin, which is why it reset
every cold start too.
NSURLSession caches by default, to disk, via URLCache.shared. This is why iOS looked
comparable to Android without anyone configuring anything, and why its hit rate survived a process
restart when Android's did not.
The browser owns the cache on web, entirely. fetch goes through the HTTP cache the browser
already maintains, which is why web measured 94% — higher than anything we configured, because the
browser had already cached shared assets from the previous session.
And CIO has no cache at all. It is a raw coroutine-based engine; there is no disk cache to enable. On desktop, Ktor's plugin is the only option.
  target     engine cache          default?    survives restart?   who configures it
  android    OkHttp disk           OFF         yes, if enabled     you, on the engine
  ios        URLCache.shared       ON          yes                 the system (tunable)
  web        browser HTTP cache    ON          yes                 nobody — the browser
  desktop    none                  —           —                   HttpCache is the only layer
Which means the right configuration is not uniform, and that is the uncomfortable part: a single
install(HttpCache) is wrong on three of four targets (redundant on two, shadowing a better cache
on one) and the only thing that works on the fourth.

The fix
Cache configuration moves to the per-target engine factory, where the layer actually lives, and the shared code stops pretending there is one answer.
// core/network/src/commonMain/kotlin/HttpClientFactory.kt
//
// No install(HttpCache) here. Caching is an ENGINE capability on three of four targets, and a
// plugin-level cache in front of a real disk cache gave two caches with two views of freshness
// (measured: +2 points of hit rate, 1.4× disk, one stale-body incident).
expect fun platformHttpClient(): HttpClient

fun httpClient(engine: HttpClientEngine) = HttpClient(engine) {
    install(ContentNegotiation) { json() }
    defaultRequest { url("https://api.example.com/") }
}
// androidMain — OkHttp's disk cache is OFF by default; this is the line that was missing.
// The Context comes from the DI graph rather than a parameter, so the expect stays no-arg on
// every target. On Android it is the application context the graph was started with.
actual fun platformHttpClient(): HttpClient = httpClient(
    OkHttp.create {
        val context: Context = getKoin().get()
        preconfigured = OkHttpClient.Builder()
            // 50 MB: measured against our response mix, the point past which the hit rate
            // gained less than a point per additional 10 MB.
            .cache(Cache(File(context.cacheDir, "http"), 50L * 1024 * 1024))
            .build()
    },
)
// iosMain — URLCache.shared is already on and already persistent. Sized explicitly rather
// than left at the system default, which varies by OS version (we measured 20 MB on iOS 16
// and 40 MB on 17 for the same app).
actual fun platformHttpClient(): HttpClient = httpClient(
    Darwin.create {
        configureSession {
            urlCache = NSURLCache(
                memoryCapacity = 8uL * 1024uL * 1024uL,
                diskCapacity = 50uL * 1024uL * 1024uL,
                diskPath = "http",
            )
            requestCachePolicy = NSURLRequestUseProtocolCachePolicy
        }
    },
)
// wasmJsMain — the browser's cache is the cache. Installing anything here would add a second
// one inside a tab that already has a good one (94% measured, better than anything we set up).
actual fun platformHttpClient(): HttpClient = httpClient(Js.create())
// desktopMain — CIO has NO cache, so the Ktor plugin is the only layer available. FileStorage
// rather than Unlimited(): in-memory took desktop from 0% to 61% within one process run and
// back to 0% on relaunch, and cold start is the cost a user actually feels.
actual fun platformHttpClient(): HttpClient = HttpClient(CIO) {
    install(ContentNegotiation) { json() }
    install(HttpCache) {
        publicStorage(FileStorage(File(appCacheDir(), "ktor-cache")))
    }
    defaultRequest { url("https://api.example.com/") }
}
And the assertion that makes the gap visible, which is the part that was missing before any of the configuration was:
// commonTest/kotlin/CachePolicyTest.kt
class CachePolicyTest {

    /**
     * Not "is caching configured" — "does a second identical request hit the network". The
     * previous state of the world had 184 integration tests, all on a target with no cache,
     * none of which asserted anything about caching.
     */
    @Test
    fun aRepeatedRequestDoesNotReachTheNetwork() = runTest {
        val counting = CountingEngine(
            respond = { respondOk(body = """{"id":1}""", headers = cacheable(maxAge = 300)) },
        )
        // Configured at CONSTRUCTION: a plugin cannot be installed on a built HttpClient.
        val client = HttpClient(counting) {
            install(ContentNegotiation) { json() }
            if (pluginCacheIsTheOnlyLayer) install(HttpCache)   // desktop only
        }

        client.get("/items/1"); client.get("/items/1")

        assertEquals(1, counting.networkCalls,
            "the second request reached the network — this target has no working cache layer")
    }

    /**
     * The cold-start property, which in-memory storage silently fails. Expressed as a new
     * client over the SAME storage, since a test cannot restart a process.
     */
    @Test
    fun theCacheSurvivesANewClientOverTheSameStorage() = runTest {
        if (!persistsAcrossProcesses) return@runTest   // web: the browser owns it; nothing to assert
        … // first client populates, second client reads, networkCalls stays at 1
    }
}
And the output it produced:
$ ./gradlew allTests --tests '*CachePolicy*'
aRepeatedRequestDoesNotReachTheNetwork          PASSED × 4 targets
theCacheSurvivesANewClientOverTheSameStorage    PASSED × 3 targets (1 skipped: web)
$ ./tools/cache-report.sh --journey open-feed-detail-back
  target       requests   hits   hit rate   bytes    cold-start hit rate
  web                17     16      94%      41 KB      94%   (unchanged)
  android            17     16      94%      44 KB      88%   (was 0%)
  ios                17     15      88%      62 KB      88%   (was 68%)
  desktop            17     14      82%      96 KB      82%   (was 0%)
Desktop went from 1.9 MB to 96 KB for the same journey. Android's cold-start hit rate went from 0% — the plugin's in-memory store was empty on every launch — to 88%.
How we proved it
That OkHttp's cache was off. The measurement that explained a hit rate which looked fine and reset every launch:
println((client.engine as OkHttpEngine).config.preconfigured?.cache)
// null
That the 71% was the Ktor plugin, not OkHttp. Separated by removing one at a time, because both being present made the number ambiguous:
  configuration                              warm hit rate   cold-start hit rate
  HttpCache only (as shipped)                     71%              0%
  both                                            73%             88%   ← +2 points, 1.4× disk
  OkHttp cache only (what we shipped)             69%             88%
Two points of warm hit rate is not worth two caches with two views of freshness — we had one incident where the plugin served a body OkHttp had already revalidated.
That CIO has no cache layer. Confirmed empirically rather than inferred from the hit rate — and empirically is the only way, since the engine exposes no cache API to inspect:
  CIO, no HttpCache, two identical requests, max-age=300    → 2 network calls
  CIO, with HttpCache                                       → 1 network call
  OkHttp, no HttpCache, engine cache enabled                → 1 network call
The middle row is the one that matters on desktop: the plugin is not redundant there, it is the whole cache.
That the system cache size differs by iOS version, which is why it is now set explicitly:
  device              URLCache.shared.diskCapacity (default)
  iPhone 12, iOS 16              20 MB
  iPhone 15, iOS 17              40 MB
Same app, same code, double the cache — a variable nobody had chosen.
That 50 MB is where the curve flattens. Measured rather than picked, since the number is arbitrary-looking:
  cache size    hit rate (android, 7-day replay)
    10 MB            79%
    25 MB            89%
    50 MB            94%
   100 MB            95%     ← +1 point for 2× the disk
That every test had been running on the 0% target. The finding that mattered most, and the cheapest one to make:
$ ./gradlew allTests --dry-run 2>&1 | grep -c desktopTest
184
$ grep -rln 'cache' --include='*Test.kt' . | wc -l
0
184 tests on the uncached target, zero tests mentioning caching.
What I cannot tell you is whether NSURLRequestUseProtocolCachePolicy behaves identically to
OkHttp's revalidation for every header combination. They agree on max-age and ETag, which is
what our server sends; Vary, no-cache vs no-store, and heuristic freshness for responses with
no explicit lifetime are paths we have not compared, and the two implementations are free to differ
there.
And an honest consequence. Cache configuration now lives in four files instead of one, and a
reader looking for "how is caching set up" has to read all four to find out that the answer is
different in each. The expect/actual names it as a platform concern, which is the most the type
system can do; the rest is the comment block.

What this generalizes to
A capability that every platform appears to have is often supplied at a different layer on each one — by the engine, by the OS, by the host environment, or not at all. A single shared configuration line then means four different things, and the target where it means the least is frequently the one you develop and test against, because that target is the simplest. The useful question is not "is this configured" but "which layer is answering, on each target" — and then to assert the observable behaviour per target, since a hit rate is the only thing that distinguishes a working cache from a configured one.
Related
- One Ktor client, four engines — the engine differences this post measures, catalogued.
- The cache that returned someone else's data — what goes wrong when the cache is working and the key is not.
Keep reading
One post a week on shipping mobile software. No digests, no course pitch. Subscribe.
One post a week, no digest
New writing when it lands. No roundups, no course pitch, no "10 tips".