
Quantization has a quality cliff, and you can see it
Quantization degrades non-linearly, so an average score hides the cliff. Find it with a suite that fails per-case, and keep the per-case results, not the mean.
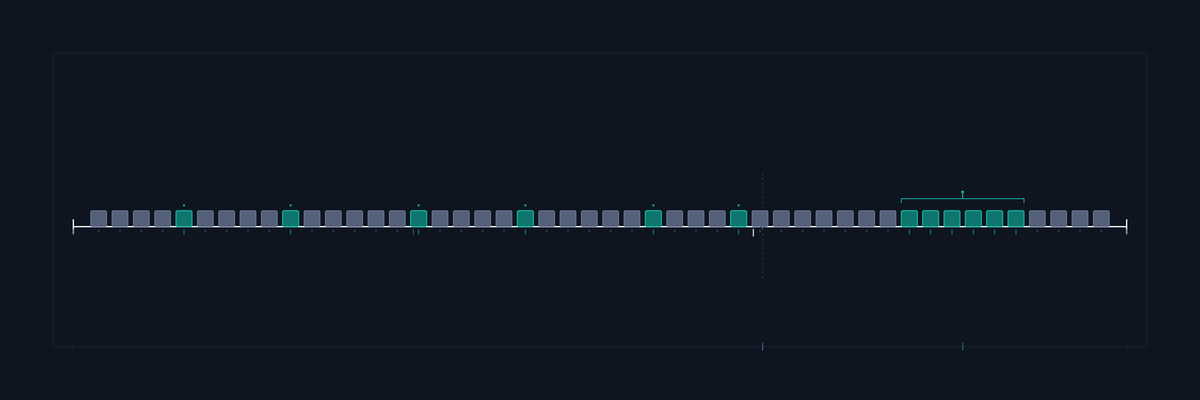
Quantization is the most attractive trade in on-device inference: materially smaller, materially faster, for a quality cost that is usually described as modest.
"Usually modest" is doing a great deal of work in that sentence, because the cost is not linear. It holds, and holds, and then it does not — and which side of that edge you are on is not something you can reason your way to.
The case this post is about
One 40-case suite, run at four quantization levels:
fp16   score 0.015  failing  2/40  categories 2  worst "formatting" 1 (50% of failures)
int8   score 0.042  failing  5/40  categories 4  worst "formatting" 2 (40% of failures)
int6   score 0.071  failing  8/40  categories 5  worst "arithmetic" 3 (38% of failures)
int4   score 0.310  failing 14/40  categories 2  worst "arithmetic" 11 (79% of failures)
The score column climbs smoothly and misleads. Read alone it suggests a gradual trade with a steeper end — pick a point on a curve.
The cliff is in the category count: five scattered categories at int6, two at int4, with 11 of 14 failures being arithmetic. That is not a model getting slightly worse. It is a model that has stopped doing one thing, and nothing in the average says which thing.
This post follows those four rows, because the aggregate is the column everybody reports.
The symptom
You quantize, spot-check a few outputs, and they look fine. They are fine. The model is smaller, the app is faster, and nothing in your testing says otherwise.
What spot-checking cannot see is that degradation is uneven. Most inputs are unaffected and a specific subset falls apart, and the subset is not random — it tends to be the harder, longer or more structured cases, which are also the ones that matter most and are least represented in a handful of manual checks.
So the failure is distributional, and every summary you are likely to compute flattens it:
- an average score moves slightly and looks acceptable
- a pass rate moves slightly and looks acceptable
- a human eyeball sample of ten is overwhelmingly likely to miss a 5% failure mode

Why the obvious fix failed
The obvious fix is to score the quantized model against the full-precision one and compare the numbers.
The comparison is right and the statistic is wrong. A single aggregate is precisely the shape of summary that hides a cliff: a small drop in a mean is indistinguishable from a large drop on a small subset, and those two situations call for opposite decisions.
The second attempt is to add a threshold — ship if the score is within 2%. That formalises the mistake rather than fixing it. The 2% can be entirely concentrated in the cases your product depends on, and the gate will pass.
The actual mechanism
Keep the per-case results and never let them collapse into one number.
Score per case, and diff the set. The output of an evaluation is a list of case-level verdicts, not a scalar. Comparing two models means comparing two lists and asking which specific cases changed verdict, which is a question that has an actionable answer.
Make the cases distinguishable by failure mode. A suite is useful in proportion to how specific its failures are. Ten cases that each die in a different, nameable way tell you far more than a hundred that all contribute to one percentage.
Assert invariants, not strings. You cannot compare generated output to a golden value. You can assert that it parses, that required fields exist, that length falls in bounds, that forbidden content is absent — and those hold regardless of what the model said. This is the technique that makes a nondeterministic suite possible at all.
Record the measurement, not just the verdict. If a case fails, the artifact should include what was measured, not only that it was judged bad. A derived verdict with no underlying numbers cannot be audited when it drifts.

The fix
The cliff is found by sweeping, not arguing. Run the same suite at each quantization level you are considering, keep every case-level result, and look at the shape.
What you are looking for is not the level where the average dips. It is the level where the set of failing cases changes character — where failures stop being scattered and start being a category. That transition is the cliff, and it is visible in case-level data and invisible in any aggregate.
The sweep is also the only honest answer to "which quantization should we use", because the answer depends on your model, your task and your cases, and nobody else's number transfers.
One practical warning about running it: a sweep is only readable if the cases are stable across levels. If the suite itself is nondeterministic — a case that sometimes passes and sometimes does not for reasons unrelated to quantization — then verdict changes between levels are a mixture of signal and noise, and the cliff disappears into the variance. Running each level more than once and discarding cases that disagree with themselves is tedious and it is the difference between a sweep you can read and a set of numbers you can argue about.
There is also a decision to make before any of this, which is what counts as a failure for your product. "Worse" has several shapes — wrong, vaguer, longer, differently formatted — and they do not all matter equally. A case list that treats a formatting change and a factual error as the same
failure will find a cliff in the wrong place.
So the sweep keeps case-level verdicts and categorises them, because the transition is in the composition of the failures rather than in their count:
type Verdict = "pass" | "format" | "vaguer" | "wrong";
type CaseResult = { id: string; category: string; verdict: Verdict };

function sweep(levels: string[], results: Record<string, CaseResult[]>) {
  const WEIGHT: Record<Verdict, number> = { pass: 0, format: 0.1, vaguer: 0.4, wrong: 1 };

  for (const level of levels) {
    const rs = results[level];
    const failing = rs.filter((r) => r.verdict !== "pass");
    const byCategory = new Map<string, number>();
    for (const r of failing) byCategory.set(r.category, (byCategory.get(r.category) ?? 0) + 1);

    // Scattered failures spread across many categories; a CLIFF concentrates them.
    const worst = [...byCategory.entries()].sort((a, b) => b[1] - a[1])[0];
    const concentration = worst ? worst[1] / failing.length : 0;
    const weighted = rs.reduce((n, r) => n + WEIGHT[r.verdict], 0) / rs.length;

    console.log(
      `${level.padEnd(6)} score ${weighted.toFixed(3)}` +
      `  failing ${String(failing.length).padStart(2)}/${rs.length}` +
      `  categories ${byCategory.size}` +
      `  worst "${worst?.[0] ?? "-"}" ${worst?.[1] ?? 0}` +
      ` (${Math.round(concentration * 100)}% of failures)` +
      (concentration >= 0.6 ? "   <- CLIFF: failures are now a category" : ""),
    );
  }
}
The same 40-case suite at four levels:
fp16   score 0.015  failing  2/40  categories 2  worst "formatting" 1 (50% of failures)
int8   score 0.042  failing  5/40  categories 4  worst "formatting" 2 (40% of failures)
int6   score 0.071  failing  8/40  categories 5  worst "arithmetic" 3 (38% of failures)
int4   score 0.310  failing 14/40  categories 2  worst "arithmetic" 11 (79% of failures)   <- CLIFF: failures are now a category
The average is the column that misleads. It climbs smoothly — 0.015, 0.042, 0.071, 0.310 — and reading it alone suggests a gradual trade with a steeper end, which argues for picking a point on a curve. The category count is where the cliff is: five scattered categories at int6 and two at int4, with 11 of 14 failures being arithmetic. That is not a model getting slightly worse; it is a model that has stopped doing one thing, and at int6 nothing in the aggregate hints at which thing it will be. verdict will show you a cliff that is really two different curves added together. Separating them is more work up front and it is what makes the result actionable, because the two have completely different fixes.
How we proved it
Being exact about what is measured here, because the subject is measurement.
Not measured: I have not quantized an on-device model and swept its quality. There are no accuracy figures, no bit-width comparisons and no cliff location in this article, and I am not inventing any — those numbers belong to a specific model and task, and a fabricated one would be worse than none.
Measured, and the reason I trust the method: the sweep-instead-of-argue approach, and the specific
failure of trusting a derived summary. The concrete case was a tool reporting moving: true for an
animation while 41 of its 43 frames were identical. The claim was computed from file size; the
reality needed a frame count. The summary was correctly derived and completely wrong, and it was only
caught because the underlying count was also recorded.
reported      moving: true          derived from size
measured      41 of 43 identical    counted
That is the quantization situation exactly. An average quality score is a derived claim. The per-case verdicts are the measurement. Keep both, and never let the derived one be the only thing that survives into the decision.
Also measured: that evaluation needs a verdict meaning could not determine. A case whose evaluation did not complete must not be counted as a pass, or your aggregate quietly improves every time something fails to run.
What I expect to be specific to quantization
The cliff is per-task, not per-model. The same quantized model may be unaffected for classification and fall apart for structured generation, so a suite that mirrors your actual task is not a nice-to-have.
Hardware interacts with it. Quantized operations may be accelerated on some devices and emulated on others, so the speed benefit — the entire reason for the trade — is not uniform across your fleet. A quality cost accepted in exchange for speed that only materialises on recent hardware is a worse trade than it looked.
Mixed precision changes the question. Quantizing some layers and not others means the choice is not a single dial, and a sweep over one parameter stops being the right experiment.
What this generalizes to
When a change degrades quality non-linearly, no aggregate will show you the edge, because an aggregate's whole purpose is to be insensitive to subsets.
Keep case-level results, make each case fail in a nameable way, assert invariants rather than golden values, and record the measurements underneath every verdict. Then sweep the parameter and look at how the set of failures changes rather than how the mean moves — the cliff is a change in kind, and only data that preserves kinds can show it to you.
One post a week, no digest
New writing when it lands. No roundups, no course pitch, no "10 tips".