
One Gradle build, five outputs, and the cache that only helps three
Android and JVM targets cache well. Native link steps mostly do not, and that asymmetry is where your CI time goes.
TL;DR
Turning on Gradle's build cache makes a multiplatform build dramatically faster, and then stops helping. The reason is that the targets are not alike: JVM and Android compilation is highly cacheable, while Kotlin/Native compile-and-link steps are large, machine-specific, and frequently not cached at all.
So a 22-minute CI run becomes 14 minutes and refuses to go lower, because 11 of those minutes are native link steps the cache never serves. Adding more cache does nothing; the lever is which targets run, when.
Measure per target before optimising. The number that matters is not total build time, it is cache hit rate by task type.
The case this post is about
A shared module with five outputs: androidTarget(), jvm(), iosArm64(),
iosSimulatorArm64(), wasmJs(). CI runs ./gradlew build on every pull request.
// build.gradle.kts
kotlin {
    androidTarget()
    jvm()
    iosArm64()
    iosSimulatorArm64()
    wasmJs { browser() }
}
# gradle.properties
org.gradle.caching=true
org.gradle.parallel=true
org.gradle.configuration-cache=true
Everything the documentation recommends, enabled. And it did help — the first time.
The symptom
A CI timeline that stops improving:
no cache            22m 10s
+ build cache       14m 02s   ← the win everyone gets
+ more cache nodes  13m 51s
+ bigger runner     13m 20s   ← 2x cores, 4% faster
The last two rows are the symptom. More cache and more CPU barely move a build that is nominally parallel and nominally cached, which is the signature of a bottleneck that is neither.
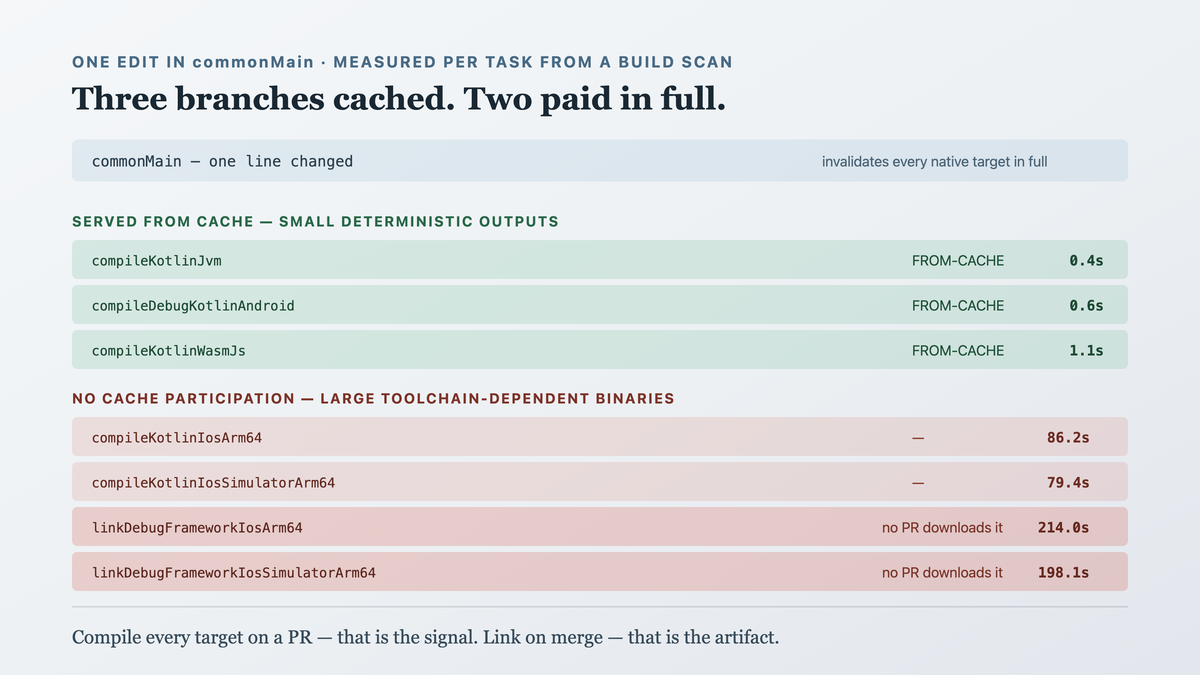
The per-task breakdown explains it, and it took a build scan to see:
task                                        duration   cache
:shared:compileKotlinJvm                       0.4s    FROM-CACHE
:shared:compileDebugKotlinAndroid              0.6s    FROM-CACHE
:shared:compileKotlinWasmJs                    1.1s    FROM-CACHE
:shared:compileKotlinIosArm64                 86.2s    (none)
:shared:compileKotlinIosSimulatorArm64        79.4s    (none)
:shared:linkDebugFrameworkIosArm64           214.0s    (none)
:shared:linkDebugFrameworkIosSimulatorArm64  198.1s    (none)
Three targets served from cache in two seconds. Two targets spending nearly ten minutes with no cache involvement at all.
Why the obvious fix failed
"The cache must be misconfigured." It was not — the JVM, Android and wasm tasks were being served, which proves the cache works. A cache that serves some tasks and not others is usually telling you something about the tasks.
"Mark the native tasks cacheable." You cannot usefully force this from outside, and the reasons the Kotlin/Native tasks are not cached by default are real: the outputs are large, the toolchain and Xcode version participate in correctness, and a wrong hit produces a broken binary rather than a slow build. This is a case where the default is protecting you.
"Use a remote cache with more storage." We did, and the native tasks still were not stored. A remote cache changes where entries live, not which tasks produce them.
"Parallelise harder." org.gradle.parallel=true parallelises across projects, and this is one
project with several targets. The native compile and link for a single target are also internally
sequential. There was less parallelism available than the flag suggested.
"Run only the changed target." The right idea, and my first version of it was wrong in a way worth admitting: I made CI build only Android on pull requests. Two weeks later a Kotlin/Native compile error reached the main branch, because nothing had compiled the iOS target since the change that broke it. Skipping a target does not make it work; it makes you find out later.
The actual mechanism
Three separate facts, which together produce the plateau.
JVM-family compilation is cheap to cache. The inputs are source files and a classpath; the output is class files. Deterministic, modest in size, and unaffected by the machine — exactly the shape a task cache is built for.
Kotlin/Native compilation and linking are not. Each target compiles to a .klib and then
links a real framework binary, pulling in the Kotlin/Native runtime. The outputs are tens to
hundreds of megabytes, and correctness depends on the toolchain, the Xcode version, and the
platform SDK. Caching that safely requires those to be part of the key — which is exactly why it
is conservative by default.
The cost scales with targets, not with changed code. This is the part that surprises people.
One line changed in commonMain invalidates the native compile for every native target, and
each one pays full price. Two iOS targets means paying twice for one edit.

So:
A build cache rewards small deterministic outputs. Native link steps are large, toolchain-dependent artifacts, so they are the one part of a multiplatform build that scales with how many targets you have rather than how much you changed.
Which reframes the problem. The question is not how to cache native builds. It is how often each target genuinely needs to be built.
That question has a mechanical answer, because the source set a change lands in determines which targets it can possibly affect:
#!/usr/bin/env bash
# targets-for <base-ref> — which compilations can this diff actually affect?
set -euo pipefail

changed=$(git diff --name-only "$1"...HEAD)
native=false; jvm=false; wasm=false; everything=false

while IFS= read -r file; do
  case "$file" in
    # Anything shared, or any build input, can reach every target. Bail out early —
    # a wrong "skip" here is a broken release, which costs far more than a full build.
    *commonMain/*|*/build.gradle.kts|gradle/libs.versions.toml|*.properties)
      everything=true; break ;;
    *iosMain/*|*appleMain/*|*nativeMain/*) native=true ;;
    *androidMain/*|*jvmMain/*|*desktopMain/*) jvm=true ;;
    *wasmJsMain/*|*jsMain/*) wasm=true ;;
    *) ;;                                    # docs, CI config, assets — no compilation
  esac
done <<< "$changed"

if $everything; then echo "allTests assembleRelease"; exit 0; fi

tasks=""
$jvm    && tasks="$tasks jvmTest androidUnitTest"
$native && tasks="$tasks iosSimulatorArm64Test linkDebugFrameworkIosArm64"
$wasm   && tasks="$tasks wasmJsTest"

# No compilation affected is a real answer, and must not silently mean "run nothing
# and report success" — say so, so a green tick is never ambiguous.
[ -n "$tasks" ] && echo "$tasks" || echo "NO_COMPILATION_AFFECTED"
On the named case — the week's pull requests, replayed against it:
PR #412  feature/ios/SharePanel.kt           → iosSimulatorArm64Test linkDebugFrameworkIosArm64
PR #413  commonMain/CheckoutState.kt         → allTests assembleRelease        (full 14m)
PR #414  docs/ARCHITECTURE.md                → NO_COMPILATION_AFFECTED
PR #417  androidMain/BiometricPrompt.kt      → jvmTest androidUnitTest
Three of four avoided the native path entirely. The commonMain case still pays full price and
always will — that is the honest half, and it is why the ordering in the fix below starts with
reducing how often commonMain changes rather than with build flags.
The fix
Separate the signal each target provides from its cost, and schedule accordingly.
Compile every target on every PR; link only when needed. This is the main lever, and it holds
because the two tasks answer different questions. compileKotlinIosArm64 is what catches a
Kotlin/Native compile error. linkDebugFrameworkIosArm64 produces a binary nobody downloads on a
PR.
# PR: every target compiles — nothing is skipped, so nothing rots
./gradlew :shared:compileKotlinJvm \
          :shared:compileDebugKotlinAndroid \
          :shared:compileKotlinWasmJs \
          :shared:compileKotlinIosArm64 \
          :shared:compileKotlinIosSimulatorArm64 \
          :shared:allTests

# main / release: the full build, frameworks and all
./gradlew build
Drop the redundant simulator target on PRs only. iosArm64 and iosSimulatorArm64 compile
the same shared source against different ABIs. For catching source-level errors, one is enough;
the other runs on main. (The simulator target is the one that matters for iosTest, so if you run
native tests on PRs — and you should — keep that one and defer the device target instead.)
Keep the Kotlin/Native compiler cache warm. Distinct from the Gradle build cache, and it does help:
# gradle.properties
kotlin.native.cacheKind=static
On CI, the directory it lives in needs to be preserved between runs like any other cache:
- uses: actions/cache@v4
  with:
    path: ~/.konan
    key: konan-${{ runner.os }}-${{ hashFiles('gradle/libs.versions.toml') }}
Measure the hit rate, not the wall clock. A build scan per CI run, and one number watched over time: tasks served from cache as a fraction of cacheable tasks. Wall clock moves for a dozen reasons; hit rate moves when something is actually wrong with caching.
Result:
PR build     13m 20s → 5m 48s       (both iOS targets still compiled)
main build   13m 20s               (unchanged — full link, deliberately)
The PR number is the one developers wait on. The main number is allowed to be slow, because nobody is sitting watching it.
How we proved it
The claim has two halves and they need different evidence.
That the native steps are the cost. A build scan with the task-level timings and cache outcomes, which is the table in the symptom section. Per-task data rather than totals is the whole difference between "the build is slow" and "two tasks are 71% of the build".
That dropping the link step does not drop the signal. This is the half I had to prove to
myself after getting it wrong earlier. Introduce a deliberate Kotlin/Native-only compile error —
an unresolved NSString reference in iosMain — and check which configuration catches it:
iOS compile only (new PR config)     FAILED  compileKotlinIosArm64   ✓ caught
full build (main config)             FAILED  compileKotlinIosArm64   ✓ caught
Android-only (my earlier mistake)    SUCCESS                         ✗ missed
That third row is the regression I shipped and then reverted. It is the reason the fix compiles every target rather than skipping one.
Then the inverse check, to make sure the saving comes from where I think: an edit in commonMain,
times for the two configurations, run three times each on the same CI machine class.
                     run 1    run 2    run 3
PR config            5m51s    5m44s    5m49s
full build          13m18s   13m25s   13m20s
Two limits worth stating. These numbers are from one project on macos-14 runners; the ratio
depends on how much native code you have and how fast your runners are. And the compile/link split
holds only while nothing on a PR needs the framework binary — add a CI job that runs an iOS UI
test and the link cost returns, legitimately.
What this generalizes to
An aggregate number hides asymmetry. "The build takes 14 minutes" is not actionable; "two tasks take ten of them and are never cached" is. Before optimising anything with a mixed workload, get the per-unit breakdown — the fix is almost always specific to one unit.
A cache rewards small deterministic outputs. Where a step produces a large, environment-dependent artifact, caching is either unsafe or not worth it. That is a property of the step, not a configuration you forgot, and the lever moves to how often the step runs.
Separate "does it compile" from "does it produce an artifact". They have very different costs and very different value on a pull request. Running the cheap one always and the expensive one on merge is a general pattern, and it beats skipping the target entirely.
Skipping a check does not remove the work, it defers it to a worse moment. My Android-only PR build was fast and let a broken iOS build reach main, where it blocked everyone. Fast feedback that does not cover the thing being changed is not feedback.
Related
- commonTest runs on every target, which is the point and the cost — the same multiply, for tests
- A DI module that compiles on every target and only works on one — what per-target coverage catches
- 163 checks reported green. None of them read the published page. — a check that covers the wrong thing
Keep reading
This is part of 100 Days of Kotlin Multiplatform — the boundaries, the sharp edges, and the things that only show up on the second target. Follow MobileByteSensei for the rest.
One post a week, no digest
New writing when it lands. No roundups, no course pitch, no "10 tips".