
Kotlin/Native memory is not the JVM's, and a retain cycle crosses the bridge
Kotlin objects held by Swift are ARC-counted. A loop through both runtimes is invisible to both profilers.
TL;DR
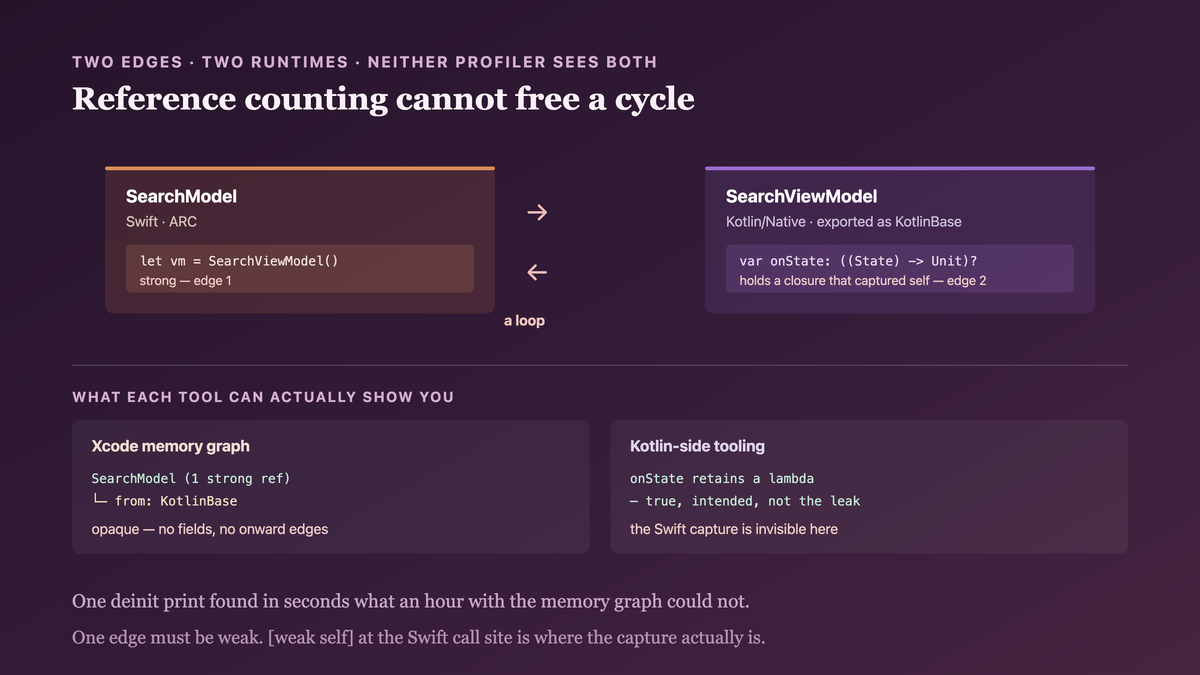
On the JVM, a cycle between two objects is collected — the tracing collector sees that neither is reachable from a root. On iOS, a Kotlin object handed to Swift is ARC-counted, and ARC cannot collect cycles.
So this leaks: Swift holds a Kotlin object, passes a Swift closure into it, and the Kotlin side
retains that closure. Two references, one loop, across two runtimes. Xcode's memory graph shows
the Swift half and a KotlinBase it cannot see into; Kotlin's own tooling does not see the Swift
half at all.
The fix is the one Swift engineers already know — break the cycle with a weak reference — applied on whichever side owns the closure. The hard part is seeing it.
The case this post is about
A shared ViewModel exposing state to SwiftUI via a callback, which is the ordinary shape:
// commonMain — exported to iOS
class SearchViewModel {
    private var onState: ((SearchStateView) -> Unit)? = null

    fun observe(listener: (SearchStateView) -> Unit) {
        onState = listener                         // ← retains the Swift closure
    }

    fun onQueryChanged(q: String) { … ; onState?.invoke(state.asView()) }
}
// SearchScreen.swift
@MainActor final class SearchModel: ObservableObject {
    @Published var state: SearchStateView = .idle
    private let vm = SearchViewModel()              // ← Swift retains the Kotlin object

    init() {
        vm.observe { state in
            self.state = state                      // ← the closure captures self, strongly
        }
    }
}
Correct-looking on both sides. SearchModel holds vm; vm holds a closure that holds
SearchModel. On Android the equivalent code is collected the moment the ViewModel goes out of
scope. On iOS it never is.
The symptom
Memory that climbs with navigation and never comes down:
Instruments → Allocations, pushing and popping the search screen

push 1   persistent 18.2 MB
push 5   persistent 41.7 MB
push 10  persistent 72.4 MB    ← nothing released on pop
Xcode's memory debugger shows the leaked SearchModel, which is where the investigation stalls.
The graph looks like this:
SearchModel  (1 strong reference)
  └── from: KotlinBase  ← opaque. no field names, no path, no onward edges
The cycle is right there and the tool shows you one half of it. KotlinBase is the Obj-C base
class every exported Kotlin object inherits; from Xcode's perspective it holds something, and its
internals are not Obj-C properties, so there is nothing to expand.
Going the other way is no better. Kotlin's own leak tooling can tell you the lambda is retained by the ViewModel — which is true, intended, and not the leak. The thing that makes it a cycle is the Swift capture, which Kotlin cannot see.
Why the obvious fix failed
"Null the listener in deinit." This is the trap, and it took me a while to see why:
deinit { vm.observe { _ in } } // never runs
deinit runs when the last strong reference goes away. The cycle is a strong reference. The
cleanup hook that would break the cycle is gated on the cycle being broken.
"Make the Kotlin field a weak reference." Kotlin/Native has WeakReference, and it does not
apply — the field holds a function, not an object. There is no supported way to weakly hold a
lambda that closed over a Swift object; the capture happened on the Swift side.
"Call a close() method from onDisappear." This works and is what we shipped, but as the
only mechanism it is fragile: it depends on every screen remembering, and SwiftUI's
onDisappear is not a guaranteed-once teardown in every navigation configuration. Correct as
defence, wrong as the primary fix.
"Use Flow instead of a callback." The right architectural answer and it does not remove the
problem by itself — a Flow collected from Swift still needs something holding the collection,
and the same capture can appear in the for await body. SKIE's AsyncSequence bridging makes
the ownership clearer, but [weak self] discipline still applies.
The actual mechanism
Two memory managers with different capabilities, meeting at an object boundary.
Kotlin/Native uses a tracing collector within its own heap. Cycles among pure Kotlin objects are collected normally — that part behaves as you expect.
A Kotlin object exposed to Swift gains ARC semantics. The exported object is an Obj-C object
(KotlinBase), and Swift's ARC retains and releases it. Its lifetime is now governed by a
reference count, and reference counting cannot free a cycle.
The cycle's two edges live in different runtimes. Edge one — Swift's let vm — is an ARC
strong reference recorded in the Swift object. Edge two — Kotlin's onState field — is a Kotlin
heap reference holding a Swift closure. Neither runtime can traverse the other's edge.

Which yields the rule:
The moment a Kotlin object crosses to Swift, its lifetime is reference-counted, and every cycle through it is permanent. The JVM habit of ignoring cycles stops being safe at exactly that boundary — and no single profiler can show you the loop.
The fix
Break the cycle where the capture happens, and make the API shape push you toward doing so.
[weak self] in every closure passed into Kotlin. This is the whole fix:
init() {
    vm.observe { [weak self] state in
        guard let self else { return }
        self.state = state
    }
}
The Kotlin side still retains the closure; the closure no longer retains SearchModel. deinit
now runs, and the chain unwinds.
Give the API a lifetime handle, so release is possible without deinit. The weak capture is
the fix; this is what makes the design honest about ownership:
// commonMain
class Subscription internal constructor(private val onCancel: () -> Unit) {
    fun cancel() = onCancel()
}

class SearchViewModel {
    private val listeners = mutableListOf<(SearchStateView) -> Unit>()

    fun observe(listener: (SearchStateView) -> Unit): Subscription {
        listeners += listener
        return Subscription { listeners -= listener }
    }
}
private var sub: Subscription?

init() {
    sub = vm.observe { [weak self] state in self?.state = state }
}
deinit { sub?.cancel() }          // now reachable, because the cycle is already broken
Two things worth being precise about:
The handle does not fix the leak; it makes teardown deterministic. With a strong capture, the
deinit still never runs. The handle is valuable for releasing early, and for making it obvious
in the type signature that an observation has a lifetime.
Returning something the caller must store is a design pressure. A function that returns a
Subscription invites a question — where do I keep this? — and that question is exactly the one
that leads to thinking about ownership. The original observe that returned Unit invited
nothing.
If the shared code must hold a reference back to a platform object, make it weak on the Kotlin side and keep the object, not a closure over it:
// commonMain
class ScreenBinding(host: Any) {
    private val ref = kotlin.native.ref.WeakReference(host)   // iosMain-shaped; see note
    fun host(): Any? = ref.get()
}
With the caveat that this is a native-only construct; a genuinely shared abstraction wants an
expect/actual weak reference, which is more machinery than most call sites need. For almost
every real case, [weak self] at the Swift call site is sufficient and is where the capture
actually is.
How we proved it
The leak is a non-release, so the assertion is about something being deallocated.
A deinit log plus a push/pop loop, which is crude and completely decisive:
deinit { print("SearchModel deinit") }
before:  push/pop × 10   →  "SearchModel deinit" printed 0 times
after:   push/pop × 10   →  "SearchModel deinit" printed 10 times
Zero to ten. No profiler needed, and it is the thing a profiler was failing to show clearly.
Then the memory curve, to confirm the deinit is actually releasing the graph behind it:
                 push 1     push 5     push 10
before          18.2 MB    41.7 MB    72.4 MB
after           18.1 MB    18.6 MB    18.4 MB
Flat across ten navigations is the result. The small residue is caches that are supposed to persist.
One honest note on the diagnosis. I found this by adding the deinit print, not by reading the
memory graph — the graph showed KotlinBase and I spent an hour trying to expand it. For a
cross-runtime cycle, an ownership assertion you can run in seconds beats a tool that can only see
one side. I would reach for the print first next time.
A limit: this covers Swift-closure-into-Kotlin, the common shape. A Kotlin object holding a Swift object (not a closure) via a strong reference has the same problem and needs the weak reference on the Kotlin side — and if that Kotlin object is itself only reachable from Swift, you are back to needing one of the two edges to be weak. The rule is that one edge must be weak; which one is a design choice.
What this generalizes to
At a runtime boundary, the weaker memory model governs. Tracing collection inside Kotlin, reference counting at the export. Whenever two memory managers meet, assume the capabilities you get are the intersection, not the union — and cycle collection is usually what you lose.
A profiler sees one runtime. Cross-boundary problems need an assertion that spans both: a deinit log, a finalizer counter, a count of live instances. Tooling is built per runtime; your bug is not.
Teardown gated on the thing you are trying to tear down never runs. deinit that breaks a
cycle, a close() called from a destructor, a cleanup hook on an object held by the leak — all
the same shape. Cleanup must be reachable from outside the thing being cleaned up.
An API that returns nothing teaches nothing about lifetime. observe() returning Unit
invites a fire-and-forget call. Returning a handle makes the caller hold something, and holding
something prompts the question of who owns it. Signatures are where ownership conventions live.
Related
- Your suspend function becomes a callback in Swift, and cancellation does not survive — the other thing the bridge drops
- Your Kotlin class becomes an Objective-C class, which is why the name is wrong — what the export does to your types
- A platform bridge is an interface with a lifetime problem — lifetimes, from the Android side
Keep reading
This is part of 100 Days of Kotlin Multiplatform — the boundaries, the sharp edges, and the things that only show up on the second target. Follow MobileByteSensei for the rest.
One post a week, no digest
New writing when it lands. No roundups, no course pitch, no "10 tips".